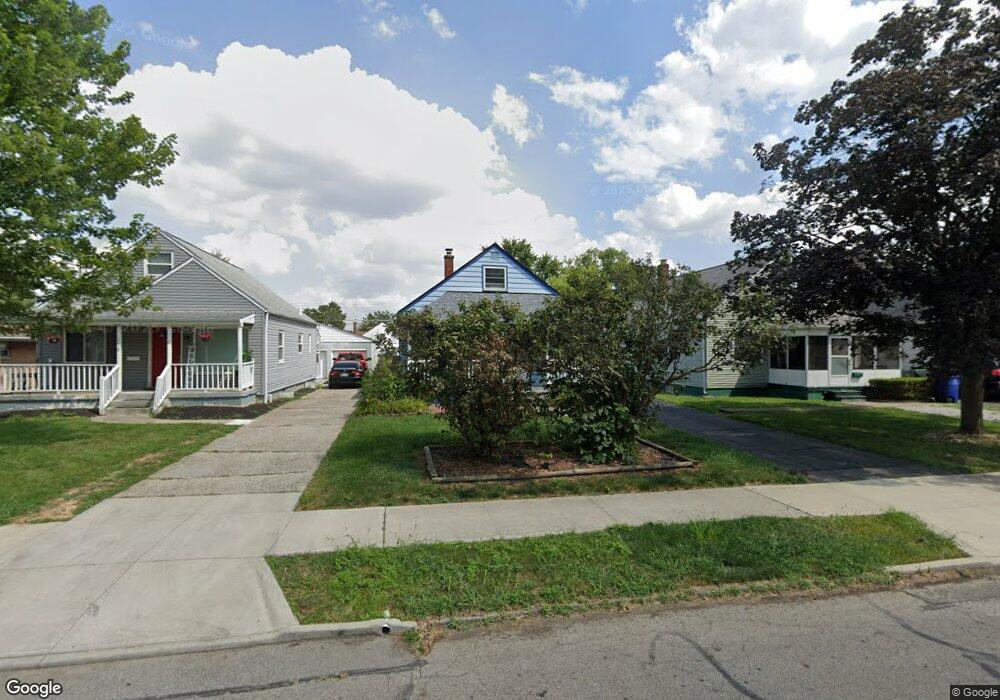
776 Binns Blvd Columbus, OH 43204
Southwest Hilltop NeighborhoodEstimated Value: $182,188 - $206,000
3
Beds
1
Bath
1,083
Sq Ft
$180/Sq Ft
Est. Value
About This Home
This home is located at 776 Binns Blvd, Columbus, OH 43204 and is currently estimated at $194,547, approximately $179 per square foot. 776 Binns Blvd is a home located in Franklin County with nearby schools including Binns Elementary School, Wedgewood Middle School, and Briggs High School.
Ownership History
Date
Name
Owned For
Owner Type
Purchase Details
Closed on
Oct 26, 2001
Sold by
Sayre Mila N and Sayre Mila N
Bought by
Shockley Paula L
Current Estimated Value
Home Financials for this Owner
Home Financials are based on the most recent Mortgage that was taken out on this home.
Original Mortgage
$79,900
Outstanding Balance
$31,229
Interest Rate
6.72%
Mortgage Type
Purchase Money Mortgage
Estimated Equity
$163,318
Purchase Details
Closed on
Nov 23, 1999
Sold by
Hill Veronica
Bought by
Sayre Mila N
Home Financials for this Owner
Home Financials are based on the most recent Mortgage that was taken out on this home.
Original Mortgage
$62,400
Interest Rate
7.9%
Purchase Details
Closed on
Jun 4, 1999
Sold by
Madigan Elizabeth A
Bought by
Hill Veronica
Home Financials for this Owner
Home Financials are based on the most recent Mortgage that was taken out on this home.
Original Mortgage
$52,700
Interest Rate
7.15%
Purchase Details
Closed on
Jun 5, 1989
Bought by
Madigan Elizabeth A
Purchase Details
Closed on
Dec 2, 1988
Create a Home Valuation Report for This Property
The Home Valuation Report is an in-depth analysis detailing your home's value as well as a comparison with similar homes in the area
Home Values in the Area
Average Home Value in this Area
Purchase History
| Date | Buyer | Sale Price | Title Company |
|---|---|---|---|
| Shockley Paula L | $87,900 | Chicago Title | |
| Sayre Mila N | $79,900 | Preferred Title Agency Inc | |
| Hill Veronica | $62,200 | Independent Title | |
| Madigan Elizabeth A | $56,100 | -- | |
| -- | -- | -- |
Source: Public Records
Mortgage History
| Date | Status | Borrower | Loan Amount |
|---|---|---|---|
| Open | Shockley Paula L | $79,900 | |
| Previous Owner | Sayre Mila N | $62,400 | |
| Previous Owner | Hill Veronica | $52,700 |
Source: Public Records
Tax History Compared to Growth
Tax History
| Year | Tax Paid | Tax Assessment Tax Assessment Total Assessment is a certain percentage of the fair market value that is determined by local assessors to be the total taxable value of land and additions on the property. | Land | Improvement |
|---|---|---|---|---|
| 2024 | $2,191 | $48,830 | $12,500 | $36,330 |
| 2023 | $2,163 | $48,825 | $12,495 | $36,330 |
| 2022 | $2,504 | $32,170 | $4,620 | $27,550 |
| 2021 | $1,671 | $32,170 | $4,620 | $27,550 |
| 2020 | $1,674 | $32,170 | $4,620 | $27,550 |
| 2019 | $1,626 | $26,810 | $3,850 | $22,960 |
| 2018 | $1,497 | $26,810 | $3,850 | $22,960 |
| 2017 | $1,568 | $26,810 | $3,850 | $22,960 |
| 2016 | $1,510 | $22,790 | $4,060 | $18,730 |
| 2015 | $1,370 | $22,790 | $4,060 | $18,730 |
| 2014 | $1,374 | $22,790 | $4,060 | $18,730 |
| 2013 | $796 | $26,775 | $4,760 | $22,015 |
Source: Public Records
Map
Nearby Homes
- 725 Binns Blvd
- 793 Binns Blvd
- 828 Binns Blvd
- 814 Chestershire Rd
- 890 S Roys Ave
- 638 Binns Blvd
- 898 Chestershire Rd
- 733 S Hague Ave
- 804 S Hague Ave
- 610 Salisbury Rd
- 3029 Rosedale Ave
- 690 S Hague Ave
- 903 S Harris Ave
- 638 Wiltshire Rd
- 737 S Brinker Ave
- 790 Racine Ave
- 2783-2785 Vanderberg Ave
- 570 Wiltshire Rd
- 805 S Warren Ave
- 1037 Chestershire Rd