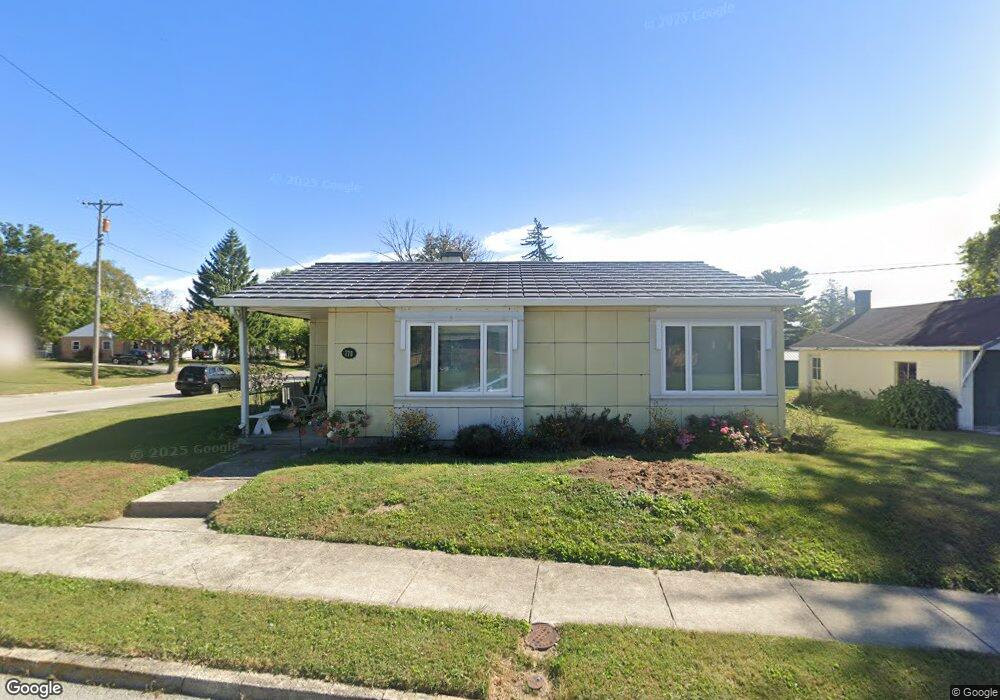
776 N Walnut St Wilmington, OH 45177
Estimated Value: $124,465 - $163,000
2
Beds
1
Bath
1,052
Sq Ft
$140/Sq Ft
Est. Value
About This Home
This home is located at 776 N Walnut St, Wilmington, OH 45177 and is currently estimated at $147,366, approximately $140 per square foot. 776 N Walnut St is a home located in Clinton County with nearby schools including East End Elementary School, Denver Place Elementary School, and Roy E. Holmes Elementary School.
Ownership History
Date
Name
Owned For
Owner Type
Purchase Details
Closed on
Sep 17, 2001
Sold by
Pendry Judith Johnson
Bought by
Miller Sally A
Current Estimated Value
Home Financials for this Owner
Home Financials are based on the most recent Mortgage that was taken out on this home.
Original Mortgage
$56,050
Outstanding Balance
$21,920
Interest Rate
7.03%
Mortgage Type
New Conventional
Estimated Equity
$125,446
Purchase Details
Closed on
Jan 1, 1990
Bought by
Johnson Judith A
Create a Home Valuation Report for This Property
The Home Valuation Report is an in-depth analysis detailing your home's value as well as a comparison with similar homes in the area
Home Values in the Area
Average Home Value in this Area
Purchase History
| Date | Buyer | Sale Price | Title Company |
|---|---|---|---|
| Miller Sally A | $59,000 | -- | |
| Johnson Judith A | -- | -- |
Source: Public Records
Mortgage History
| Date | Status | Borrower | Loan Amount |
|---|---|---|---|
| Open | Miller Sally A | $56,050 |
Source: Public Records
Tax History Compared to Growth
Tax History
| Year | Tax Paid | Tax Assessment Tax Assessment Total Assessment is a certain percentage of the fair market value that is determined by local assessors to be the total taxable value of land and additions on the property. | Land | Improvement |
|---|---|---|---|---|
| 2024 | $527 | $25,310 | $420 | $24,890 |
| 2023 | $527 | $25,310 | $420 | $24,890 |
| 2022 | $717 | $20,080 | $330 | $19,750 |
| 2021 | $725 | $20,080 | $330 | $19,750 |
| 2020 | $681 | $20,080 | $330 | $19,750 |
| 2019 | $562 | $15,130 | $350 | $14,780 |
| 2018 | $568 | $15,130 | $350 | $14,780 |
| 2017 | $552 | $15,130 | $350 | $14,780 |
| 2016 | $614 | $16,650 | $4,640 | $12,010 |
| 2015 | $604 | $16,650 | $4,640 | $12,010 |
| 2013 | $628 | $17,100 | $4,640 | $12,460 |
Source: Public Records
Map
Nearby Homes
- 813 N Lincoln St
- 165 Lorish Ave
- 31 Fairland Ave
- 215 Leyland Park Dr Unit 1C
- 841 Ohio Ave
- 988 N South St
- 977 N South St
- 996 N South St
- 966 N South St
- 1015 N South St
- 987 N South St
- 1005 N South St
- 320 Lorish Ave
- 174 B St
- 18 E Kentucky Ave
- 125 E Kentucky Ave
- 379 Virginia Cir
- 353 Hiatt Ave
- 332 Leyland Park Dr Unit 22B
- Cabral Plan at Creekview
- 118 E Ruby Ave
- 754 N Walnut St
- 128 E Ruby Ave
- 755 N Walnut St
- 738 N Walnut St
- 68 E Ruby Ave
- 111 E Ruby Ave
- 730 N Walnut St
- 99 E Ruby Ave
- 143 E Ruby Ave
- 127 E Ruby Ave
- 771 N Lincoln St
- 777 N Lincoln St
- 757 N Lincoln St
- 741 N Walnut St
- 718 N Walnut St
- 58 E Ruby Ave
- 83 E Ruby Ave
- 741 N Lincoln St
- 735 N Lincoln St