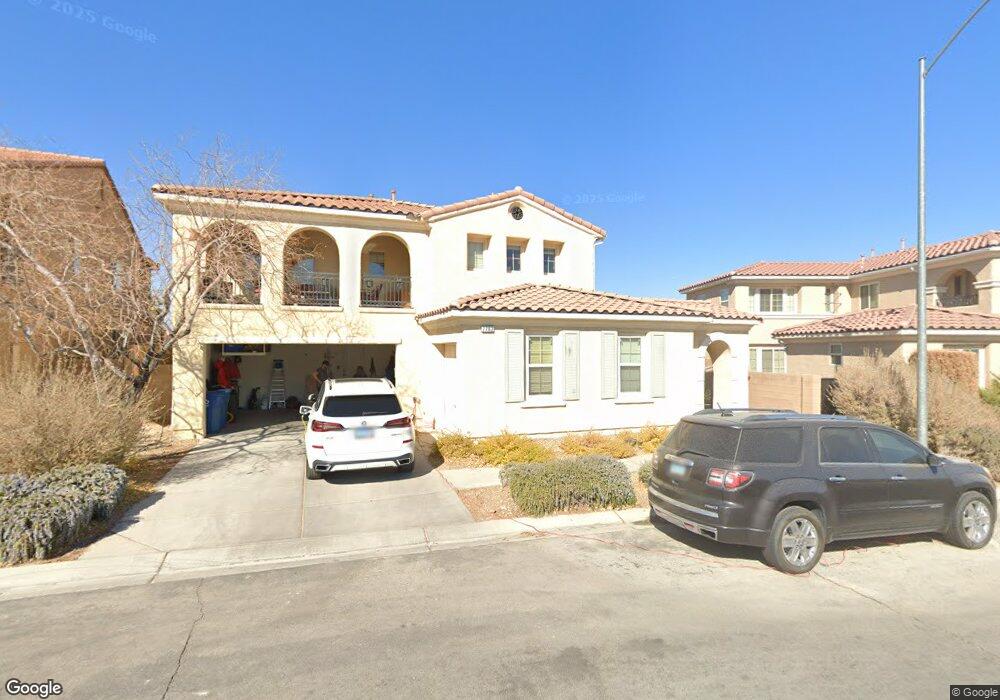
7762 Comanche Canyon Ave Las Vegas, NV 89113
Coronado Ranch NeighborhoodEstimated Value: $741,215 - $801,000
4
Beds
4
Baths
3,302
Sq Ft
$235/Sq Ft
Est. Value
About This Home
This home is located at 7762 Comanche Canyon Ave, Las Vegas, NV 89113 and is currently estimated at $776,054, approximately $235 per square foot. 7762 Comanche Canyon Ave is a home located in Clark County with nearby schools including Judith D Steele Elementary School, Lawrence & Heidi Canarelli Middle School, and Sierra Vista High School.
Ownership History
Date
Name
Owned For
Owner Type
Purchase Details
Closed on
Feb 27, 2009
Sold by
Indymac Federal Bank Fsb
Bought by
Schmidt Allison R
Current Estimated Value
Home Financials for this Owner
Home Financials are based on the most recent Mortgage that was taken out on this home.
Original Mortgage
$265,567
Outstanding Balance
$169,044
Interest Rate
5.15%
Mortgage Type
FHA
Estimated Equity
$607,010
Purchase Details
Closed on
Nov 11, 2008
Sold by
Magdael Noel T and Magdael Grichchaya
Bought by
Indymac Bank Fsb
Purchase Details
Closed on
Jul 20, 2006
Sold by
Pardee Homes Of Nevada
Bought by
Magdael Noel and Magdael Grichchaya
Home Financials for this Owner
Home Financials are based on the most recent Mortgage that was taken out on this home.
Original Mortgage
$483,480
Interest Rate
1.75%
Mortgage Type
Negative Amortization
Create a Home Valuation Report for This Property
The Home Valuation Report is an in-depth analysis detailing your home's value as well as a comparison with similar homes in the area
Home Values in the Area
Average Home Value in this Area
Purchase History
| Date | Buyer | Sale Price | Title Company |
|---|---|---|---|
| Schmidt Allison R | $290,000 | Noble Title | |
| Indymac Bank Fsb | $318,542 | Fidelity National | |
| Magdael Noel | $586,950 | First Amer Title Co Of Nv |
Source: Public Records
Mortgage History
| Date | Status | Borrower | Loan Amount |
|---|---|---|---|
| Open | Schmidt Allison R | $265,567 | |
| Previous Owner | Magdael Noel | $483,480 |
Source: Public Records
Tax History Compared to Growth
Tax History
| Year | Tax Paid | Tax Assessment Tax Assessment Total Assessment is a certain percentage of the fair market value that is determined by local assessors to be the total taxable value of land and additions on the property. | Land | Improvement |
|---|---|---|---|---|
| 2025 | $4,952 | $194,794 | $54,250 | $140,544 |
| 2024 | $4,873 | $194,794 | $54,250 | $140,544 |
| 2023 | $4,873 | $180,247 | $47,250 | $132,997 |
| 2022 | $4,247 | $162,772 | $42,000 | $120,772 |
| 2021 | $4,196 | $151,530 | $36,750 | $114,780 |
| 2020 | $3,648 | $150,108 | $36,750 | $113,358 |
| 2019 | $3,419 | $144,688 | $33,250 | $111,438 |
| 2018 | $3,263 | $133,554 | $26,950 | $106,604 |
| 2017 | $3,946 | $134,561 | $26,600 | $107,961 |
| 2016 | $3,054 | $132,586 | $21,000 | $111,586 |
| 2015 | $3,048 | $114,392 | $17,850 | $96,542 |
| 2014 | $2,953 | $101,913 | $10,500 | $91,413 |
Source: Public Records
Map
Nearby Homes
- 7703 W Mesa Verde Ln
- 7861 Hamilton Pool Dr
- 7681 W Mesa Verde Ln
- 7619 Comanche Canyon Ave
- 7756 Seville Estates Ct
- 7837 Hamilton Pool Dr
- 7701 W Robindale Rd Unit 127
- 7701 W Robindale Rd Unit 160
- 7701 W Robindale Rd Unit 274
- 7701 W Robindale Rd Unit 259
- 7977 Texas Hills St
- 7708 Park Village Place
- 7983 Texas Hills St
- 7609 Slide Rock Ave
- 7607 Pioneer Ranch Ave
- 7975 Mesquite Ranch St
- 8003 Adelaide Hills St
- 7584 Slide Rock Ave
- 8057 Adelaide Hills St
- 7427 Wagonwheel Ranch Way
- 7750 Comanche Canyon Ave
- 7835 Alameda Creek St
- 7753 Comanche Canyon Ave
- 7834 Alameda Creek St
- 7735 Comanche Canyon Ave
- 7726 Comanche Canyon Ave
- 7845 Alameda Creek St
- 7854 Alameda Creek St
- 7714 Comanche Canyon Ave
- 7730 Ironwood Knoll Ave
- 7855 Alameda Creek St
- 7715 Comanche Canyon Ave
- 7711 Comanche Canyon Ave
- 7864 Alameda Creek St
- 7720 Ironwood Knoll Ave
- 7702 Comanche Canyon Ave
- 7865 Alameda Creek St
- S S Buffalo Dr
- 7860 Hamilton Pool Dr