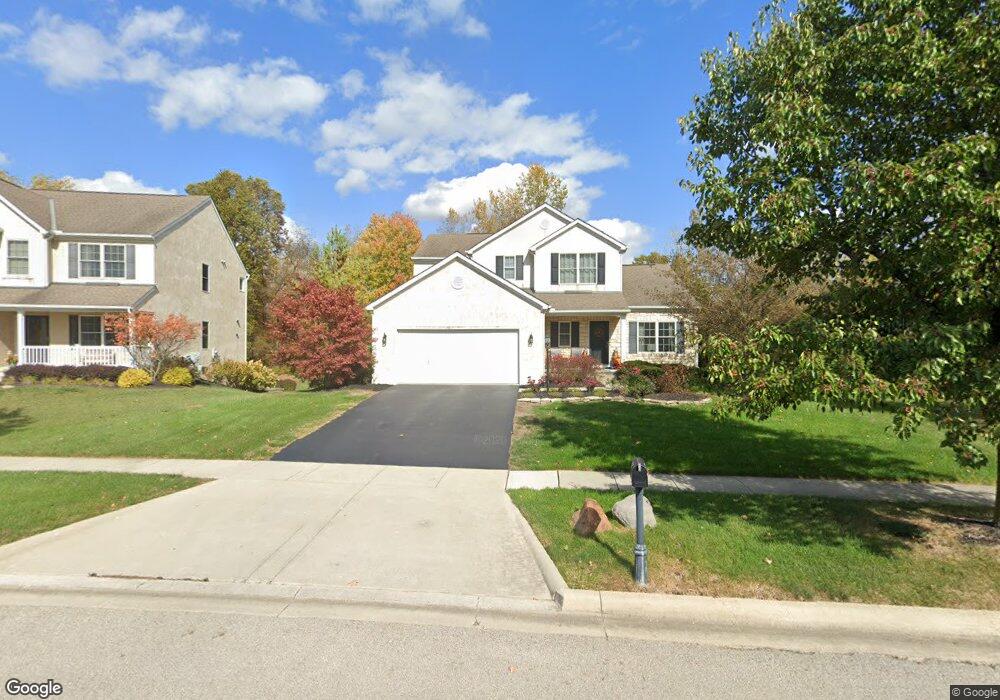
7763 Marrisey Loop Galena, OH 43021
Estimated Value: $527,000 - $669,000
4
Beds
4
Baths
3,472
Sq Ft
$169/Sq Ft
Est. Value
About This Home
This home is located at 7763 Marrisey Loop, Galena, OH 43021 and is currently estimated at $587,782, approximately $169 per square foot. 7763 Marrisey Loop is a home located in Delaware County with nearby schools including Big Walnut Elementary School, Big Walnut Intermediate School, and Big Walnut Middle School.
Ownership History
Date
Name
Owned For
Owner Type
Purchase Details
Closed on
Nov 23, 2011
Sold by
Kramer Stephanie F and Kramer Brian M
Bought by
Gorringe Timothy P and Gorringe Sandra S
Current Estimated Value
Home Financials for this Owner
Home Financials are based on the most recent Mortgage that was taken out on this home.
Original Mortgage
$292,393
Outstanding Balance
$197,934
Interest Rate
3.87%
Mortgage Type
FHA
Estimated Equity
$389,848
Purchase Details
Closed on
Jan 13, 2005
Sold by
Dominion Homes Inc
Bought by
Kramer Brian M and Kramer Stephanie F
Home Financials for this Owner
Home Financials are based on the most recent Mortgage that was taken out on this home.
Original Mortgage
$242,978
Interest Rate
6.99%
Mortgage Type
Purchase Money Mortgage
Create a Home Valuation Report for This Property
The Home Valuation Report is an in-depth analysis detailing your home's value as well as a comparison with similar homes in the area
Home Values in the Area
Average Home Value in this Area
Purchase History
| Date | Buyer | Sale Price | Title Company |
|---|---|---|---|
| Gorringe Timothy P | $300,000 | Attorney | |
| Kramer Brian M | $303,800 | Alliance Title |
Source: Public Records
Mortgage History
| Date | Status | Borrower | Loan Amount |
|---|---|---|---|
| Open | Gorringe Timothy P | $292,393 | |
| Previous Owner | Kramer Brian M | $242,978 | |
| Closed | Kramer Brian M | $60,744 |
Source: Public Records
Tax History
| Year | Tax Paid | Tax Assessment Tax Assessment Total Assessment is a certain percentage of the fair market value that is determined by local assessors to be the total taxable value of land and additions on the property. | Land | Improvement |
|---|---|---|---|---|
| 2024 | $6,686 | $148,900 | $36,930 | $111,970 |
| 2023 | $6,589 | $148,900 | $36,930 | $111,970 |
| 2022 | $6,171 | $119,390 | $25,730 | $93,660 |
| 2021 | $6,200 | $119,390 | $25,730 | $93,660 |
| 2020 | $6,215 | $119,390 | $25,730 | $93,660 |
| 2019 | $6,151 | $113,270 | $25,730 | $87,540 |
| 2018 | $5,722 | $113,270 | $25,730 | $87,540 |
| 2017 | $5,305 | $109,170 | $23,170 | $86,000 |
| 2016 | $5,192 | $109,170 | $23,170 | $86,000 |
| 2015 | $5,218 | $109,170 | $23,170 | $86,000 |
| 2014 | $5,248 | $109,170 | $23,170 | $86,000 |
| 2013 | $5,432 | $106,650 | $23,170 | $83,480 |
Source: Public Records
Map
Nearby Homes
- 4772 S Old 3c Hwy
- 4703 Talus Rd
- 5287 Genoa Farms Blvd
- 7380 Lewis Center Rd
- 6677 Via Florenza Dr
- 5645 Covington Meadows Dr
- 5349 Slater Ridge Unit 5349
- 7513 Upper Cambridge Way
- 6398 Garden Loop
- 6192 Garden Loop
- 6206 Garden Loop
- 5833 S Old 3c Hwy
- 5217 Sierra Dr
- 5040 Sunbury Rd
- 6059 Victory Ln
- 6024 Victory Ln
- 5335 Hoover Gate Ln
- 6623 Henschen Cir
- 6045 Medallion Dr W
- 6136 Keats Place
- 7749 Marrisey Loop
- 7777 Marrisey Loop
- 7733 Marrisey Loop
- 7733 Marrisey Loop Unit 6994
- 7793 Marrisey Loop
- 7772 Marrisey Loop
- 7740 Marrisey Loop
- 7719 Marrisey Loop
- 7719 Marrisey Loop Unit 6995
- 7795 Vinmar Way
- 7701 Marrisey Loop
- 7700 Marrisey Loop Unit 7018
- 7815 Vinmar Way
- 7835 Vinmar Way
- 7835 Vinmar Way Unit 6987
- 7683 Marrisey Loop
- 4802 Chimera Loop
- 7855 Vinmar Way
- 7055 Marrisey Loop
- 7055 Marrisey Loop Unit 7022
Your Personal Tour Guide
Ask me questions while you tour the home.