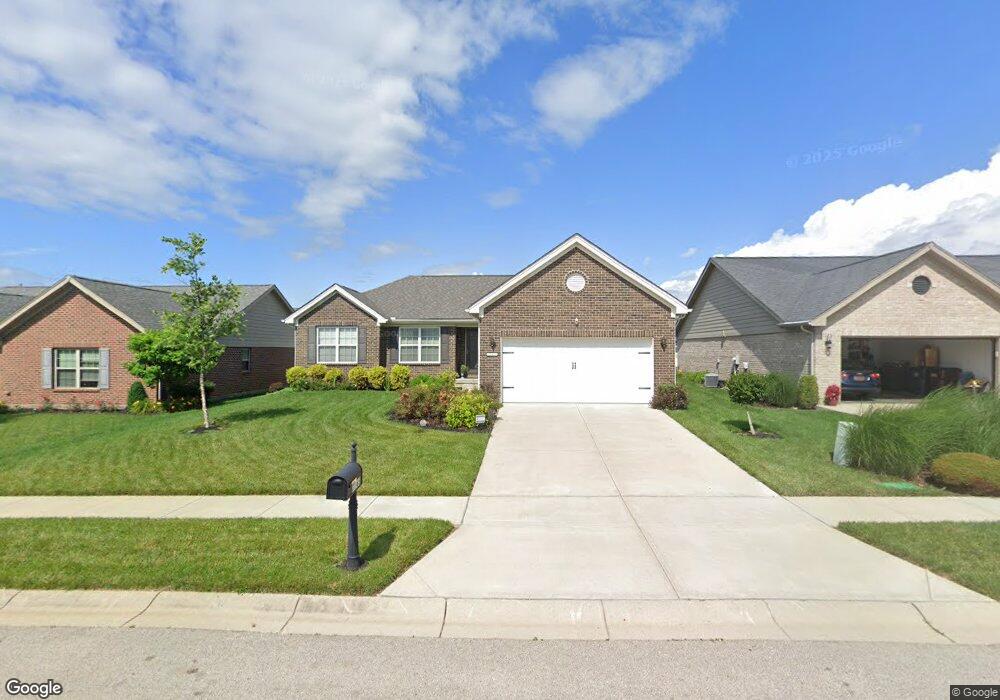
7765 Cilantro Way Clayton, OH 45315
Estimated Value: $330,823 - $380,000
3
Beds
3
Baths
1,520
Sq Ft
$235/Sq Ft
Est. Value
About This Home
This home is located at 7765 Cilantro Way, Clayton, OH 45315 and is currently estimated at $357,956, approximately $235 per square foot. 7765 Cilantro Way is a home with nearby schools including Northmoor Elementary School, Northmont High School, and Salem Christian Academy.
Ownership History
Date
Name
Owned For
Owner Type
Purchase Details
Closed on
Mar 25, 2019
Sold by
Inverness Group Inc
Bought by
Inverness Group Inc
Current Estimated Value
Home Financials for this Owner
Home Financials are based on the most recent Mortgage that was taken out on this home.
Interest Rate
4.28%
Purchase Details
Closed on
Mar 11, 2019
Sold by
Inverness Group Incorporated
Bought by
Walker Lorenzo L and Walker Jacquline
Home Financials for this Owner
Home Financials are based on the most recent Mortgage that was taken out on this home.
Interest Rate
4.28%
Purchase Details
Closed on
Mar 27, 2008
Sold by
Wenger Road Development Co Llc
Bought by
Inverness Group Inc
Home Financials for this Owner
Home Financials are based on the most recent Mortgage that was taken out on this home.
Original Mortgage
$15,000,000
Interest Rate
6.32%
Mortgage Type
Credit Line Revolving
Create a Home Valuation Report for This Property
The Home Valuation Report is an in-depth analysis detailing your home's value as well as a comparison with similar homes in the area
Home Values in the Area
Average Home Value in this Area
Purchase History
| Date | Buyer | Sale Price | Title Company |
|---|---|---|---|
| Inverness Group Inc | $212,670 | -- | |
| Walker Lorenzo L | $212,700 | Sterling Land Title Agcy Inc | |
| Inverness Group Inc | $42,400 | None Available |
Source: Public Records
Mortgage History
| Date | Status | Borrower | Loan Amount |
|---|---|---|---|
| Closed | Inverness Group Inc | -- | |
| Open | Walker Lorenzo L | $219,650 | |
| Previous Owner | Inverness Group Inc | $15,000,000 |
Source: Public Records
Tax History Compared to Growth
Tax History
| Year | Tax Paid | Tax Assessment Tax Assessment Total Assessment is a certain percentage of the fair market value that is determined by local assessors to be the total taxable value of land and additions on the property. | Land | Improvement |
|---|---|---|---|---|
| 2024 | $5,376 | $90,560 | $16,940 | $73,620 |
| 2023 | $5,376 | $90,560 | $16,940 | $73,620 |
| 2022 | $5,665 | $74,840 | $14,000 | $60,840 |
| 2021 | $5,944 | $74,840 | $14,000 | $60,840 |
| 2020 | $5,940 | $74,840 | $14,000 | $60,840 |
| 2019 | $812 | $7,700 | $7,700 | $0 |
| 2018 | $814 | $7,700 | $7,700 | $0 |
| 2017 | $810 | $7,700 | $7,700 | $0 |
| 2016 | $768 | $7,000 | $7,000 | $0 |
| 2015 | $727 | $7,000 | $7,000 | $0 |
| 2014 | $719 | $7,000 | $7,000 | $0 |
| 2012 | -- | $9,800 | $9,800 | $0 |
Source: Public Records
Map
Nearby Homes
- 5769 Dill Blvd
- 7739 Cilantro Way
- 7746 Cilantro Way
- 7706 Cilantro Way
- 7980 Parsley Place
- 7754 Cilantro Way
- 7750 Cilantro Way
- Chatham Plan at Wenger Village
- Milford Plan at Wenger Village
- Holcombe Plan at Wenger Village
- Newcastle Plan at Wenger Village
- Pendleton Plan at Wenger Village
- Bellamy Plan at Wenger Village
- Henley Plan at Wenger Village
- 7776 Crestway Rd
- 7710 Crestway Dr
- 508 Korner Ave
- 558 Clinton St
- 0 Meiring St Unit 866058
- 4784 Molunat
- 7771 Cilantro Way Lot #11
- 7771 Cilantro Way
- 7759 Cilantro Way Unit 9 Lot
- 7759 Cilantro Way
- 7777 Cilantro Way Unit Lot12
- 7777 Cilantro Way
- 7714 Cilantro Way
- 7852 Marjoram Place
- 7846 Marjoram Place
- 7858 Marjoram Place Unit Lot17
- 7858 Marjoram Place
- 0 Cilantro Way
- 7770 Cilantro Way
- 7840 Marjoram Place Unit Lot20
- 7840 Marjoram Place
- 7783 Cilantro Way
- 7864 Marjoram Place
- 7764 Cilantro Way
- 7758 Cilantro Way Lot #8
- 7758 Cilantro Way