7767 Davidson Rd Sanger, TX 76266
Estimated Value: $247,000 - $474,000
3
Beds
2
Baths
1,880
Sq Ft
$202/Sq Ft
Est. Value
About This Home
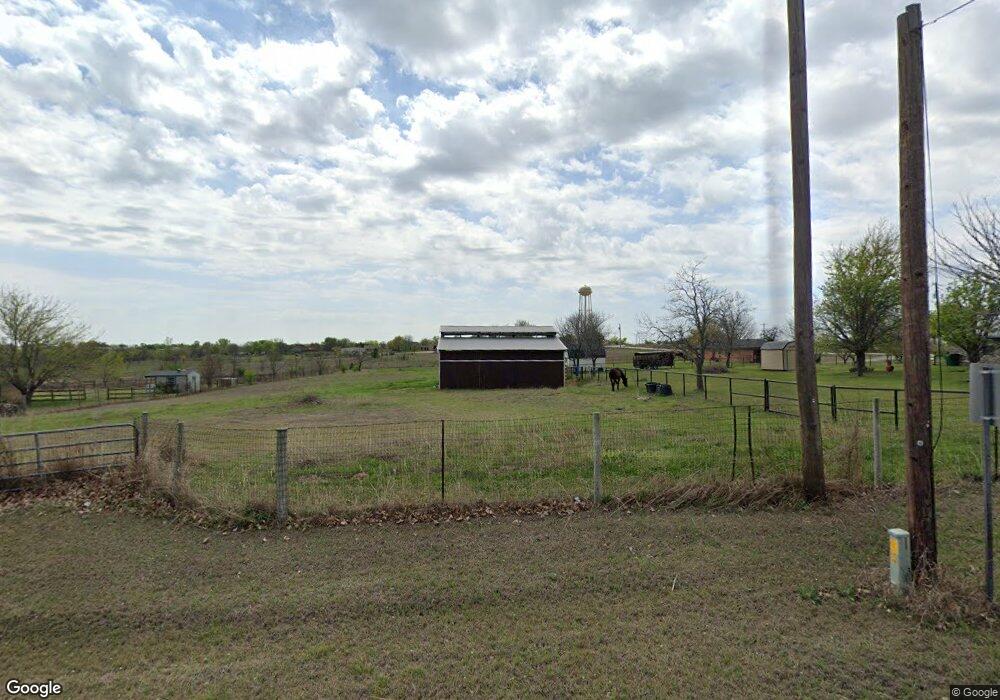
This home is located at 7767 Davidson Rd, Sanger, TX 76266 and is currently estimated at $380,121, approximately $202 per square foot. 7767 Davidson Rd is a home located in Denton County with nearby schools including Chisholm Trail Elementary School, Clear Creek Intermediate School, and Sanger Sixth Grade Campus.
Ownership History
Date
Name
Owned For
Owner Type
Purchase Details
Closed on
Jul 2, 2014
Sold by
Hatfield Donna G
Bought by
Mitchell Mary Lynn
Current Estimated Value
Home Financials for this Owner
Home Financials are based on the most recent Mortgage that was taken out on this home.
Original Mortgage
$155,102
Outstanding Balance
$117,584
Interest Rate
4.19%
Mortgage Type
New Conventional
Estimated Equity
$262,537
Purchase Details
Closed on
Jul 27, 2009
Sold by
Richards Terri A
Bought by
Hatfield Donna G
Home Financials for this Owner
Home Financials are based on the most recent Mortgage that was taken out on this home.
Original Mortgage
$31,500
Interest Rate
5.41%
Mortgage Type
Purchase Money Mortgage
Purchase Details
Closed on
Apr 13, 2006
Sold by
Richards Robert B and Richards Terri A
Bought by
Richards Terri A
Home Financials for this Owner
Home Financials are based on the most recent Mortgage that was taken out on this home.
Original Mortgage
$60,000
Interest Rate
6.36%
Mortgage Type
Fannie Mae Freddie Mac
Create a Home Valuation Report for This Property
The Home Valuation Report is an in-depth analysis detailing your home's value as well as a comparison with similar homes in the area
Home Values in the Area
Average Home Value in this Area
Purchase History
| Date | Buyer | Sale Price | Title Company |
|---|---|---|---|
| Mitchell Mary Lynn | -- | Title Resources | |
| Hatfield Donna G | -- | None Available | |
| Richards Terri A | -- | First American |
Source: Public Records
Mortgage History
| Date | Status | Borrower | Loan Amount |
|---|---|---|---|
| Open | Mitchell Mary Lynn | $155,102 | |
| Previous Owner | Hatfield Donna G | $31,500 | |
| Previous Owner | Richards Terri A | $60,000 |
Source: Public Records
Tax History
| Year | Tax Paid | Tax Assessment Tax Assessment Total Assessment is a certain percentage of the fair market value that is determined by local assessors to be the total taxable value of land and additions on the property. | Land | Improvement |
|---|---|---|---|---|
| 2025 | $695 | $252,092 | $107,538 | $144,554 |
| 2024 | $3,230 | $237,959 | $0 | $0 |
| 2023 | $694 | $216,326 | $105,450 | $199,547 |
| 2022 | $3,262 | $196,660 | $35,150 | $161,510 |
| 2021 | $2,808 | $192,472 | $47,804 | $144,668 |
| 2020 | $3,020 | $192,244 | $47,804 | $144,440 |
| 2019 | $3,198 | $195,425 | $47,804 | $147,621 |
| 2018 | $2,809 | $170,382 | $35,150 | $135,232 |
| 2017 | $2,716 | $163,595 | $35,150 | $128,445 |
| 2016 | $2,697 | $136,120 | $18,278 | $117,842 |
| 2015 | $1,871 | $126,891 | $18,278 | $108,613 |
| 2013 | -- | $102,630 | $18,278 | $84,352 |
Source: Public Records
Map
Nearby Homes
- 6958 Michael Rd
- 7140 Davidson Rd
- 14158 Crest View Rd
- 8875 Fm 2450
- 6400 Ridgerock Dr
- 6044 Mango Dr
- TBD Michael Rd
- 6041 Amber Dr
- 6033 Mango Dr
- 6037 Amber Dr
- 6210 Deer Run Rd
- . Fm 2450 & Indian Trail
- 8774 Kassandra Dr
- 6221 Deer Run Rd
- 8797 Kassandra Dr
- 6009 Amber Dr
- 6713 Mustang Trail
- 11007 Farm To Market Road 2450
- 6807 Sam Bass Rd
- 10350 W Clear Creek Rd
- 7717 Davidson Rd
- 9238 Indian Trail
- 9268 Indian Trail
- 7802 Davidson Rd
- 7768 Davidson Rd
- 7754 Davidson Rd
- 7732 Davidson Rd
- 8495 Davidson Rd
- 8441 Davidson Rd
- 8461 Davidson Rd
- 8481 Davidson Rd
- 7684 Davidson Rd
- 9370 Indian Trail
- 8129 Shaw Rd
- 1580 Shaw Rd
- 9090 Indian Trail
- 7480 Davidson Rd
- 9415 Indian Trail
- 7674 Michael Rd
- 9470 Indian Trail
Your Personal Tour Guide
Ask me questions while you tour the home.