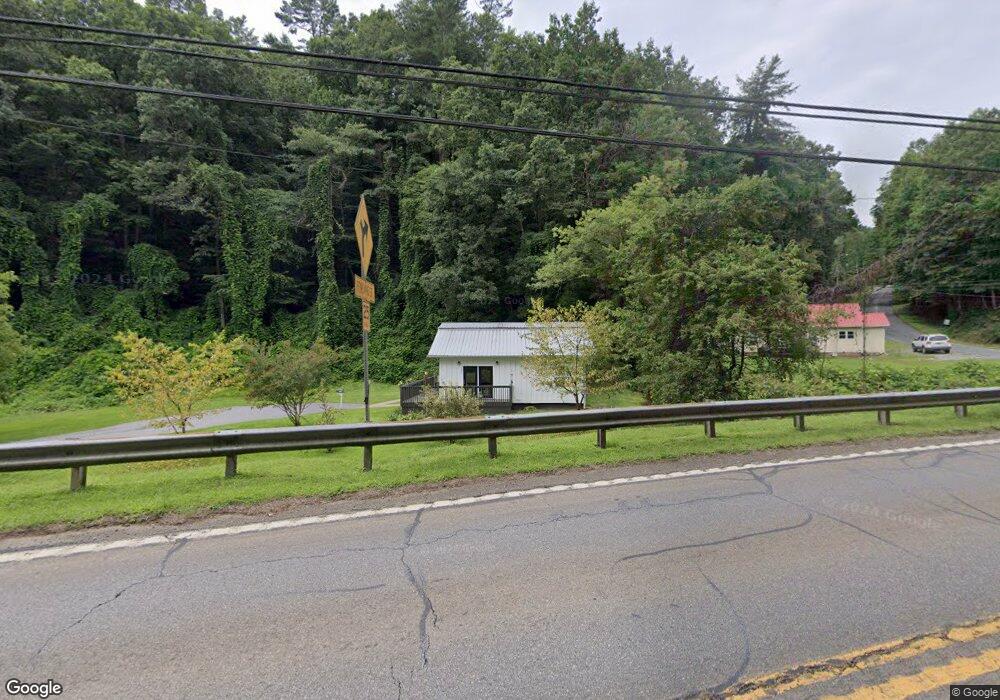
777 Dalton St Ellijay, GA 30540
Estimated Value: $243,000 - $332,000
2
Beds
2
Baths
1,512
Sq Ft
$188/Sq Ft
Est. Value
About This Home
This home is located at 777 Dalton St, Ellijay, GA 30540 and is currently estimated at $284,957, approximately $188 per square foot. 777 Dalton St is a home with nearby schools including Ellijay Elementary School, Clear Creek Elementary School, and Clear Creek Middle School.
Ownership History
Date
Name
Owned For
Owner Type
Purchase Details
Closed on
Mar 2, 2017
Sold by
Harold
Bought by
Benny Adams Properties Llc
Current Estimated Value
Home Financials for this Owner
Home Financials are based on the most recent Mortgage that was taken out on this home.
Original Mortgage
$35,000
Outstanding Balance
$6,227
Interest Rate
4.19%
Mortgage Type
New Conventional
Estimated Equity
$278,730
Purchase Details
Closed on
Dec 1, 2016
Sold by
Gronholm Scott
Bought by
Gronholm Gregory T and Gronholm Harold
Purchase Details
Closed on
Mar 31, 1999
Sold by
Hathorn Mitch C and Hathorn O
Bought by
Gronholm Scott
Purchase Details
Closed on
Jan 11, 1999
Sold by
Hathorn Mitch C and Hathorn O
Bought by
Hathorn Mitch C and Hathorn O
Purchase Details
Closed on
Dec 14, 1998
Sold by
Arledge Donald D
Bought by
Hathorn Mitch C and Hathorn O
Purchase Details
Closed on
Sep 1, 1995
Bought by
Arledge Donald D
Create a Home Valuation Report for This Property
The Home Valuation Report is an in-depth analysis detailing your home's value as well as a comparison with similar homes in the area
Home Values in the Area
Average Home Value in this Area
Purchase History
| Date | Buyer | Sale Price | Title Company |
|---|---|---|---|
| Benny Adams Properties Llc | $40,000 | -- | |
| Gronholm Gregory T | -- | -- | |
| Gronholm Scott | $54,000 | -- | |
| Hathorn Mitch C | $45,000 | -- | |
| Hathorn Mitch C | $45,000 | -- | |
| Arledge Donald D | $52,500 | -- |
Source: Public Records
Mortgage History
| Date | Status | Borrower | Loan Amount |
|---|---|---|---|
| Open | Benny Adams Properties Llc | $35,000 |
Source: Public Records
Tax History Compared to Growth
Tax History
| Year | Tax Paid | Tax Assessment Tax Assessment Total Assessment is a certain percentage of the fair market value that is determined by local assessors to be the total taxable value of land and additions on the property. | Land | Improvement |
|---|---|---|---|---|
| 2024 | $1,378 | $79,280 | $10,000 | $69,280 |
| 2023 | $1,441 | $79,280 | $10,000 | $69,280 |
| 2022 | $1,102 | $62,640 | $7,600 | $55,040 |
| 2021 | $917 | $46,200 | $7,600 | $38,600 |
| 2020 | $800 | $36,360 | $4,200 | $32,160 |
| 2019 | $823 | $36,360 | $4,200 | $32,160 |
| 2018 | $587 | $25,600 | $2,720 | $22,880 |
| 2017 | $500 | $20,320 | $2,360 | $17,960 |
| 2016 | $525 | $20,920 | $2,360 | $18,560 |
| 2015 | $456 | $18,480 | $2,360 | $16,120 |
| 2014 | $502 | $19,600 | $2,360 | $17,240 |
| 2013 | -- | $20,640 | $2,360 | $18,280 |
Source: Public Records
Map
Nearby Homes
- 66 Logan Ln
- 84 Logan St
- 165 Corbin Hill Rd
- 114 Vista Heights Dr
- Lot 95 Cedar St
- Lot 95 Cedar St Unit 95
- 14551 Highway 52
- LT 43&44 Reece Mountain Rd
- 00 Highgrove Dr
- N/A Willard Mountain Rd
- 163 Jasmine Ct
- 0 Georgia 52
- 00 Timberland Dr
- 36 Timberland Dr
- 300 Westwoods Dr Unit 36
- 300 Westwoods Dr
- 276 Westwoods Dr Unit 37
- 276 Westwoods Dr
- LT 104 River Knoll Trail
- Lot 6 Parkview Dr S