Estimated Value: $407,000 - $457,000
About This Home
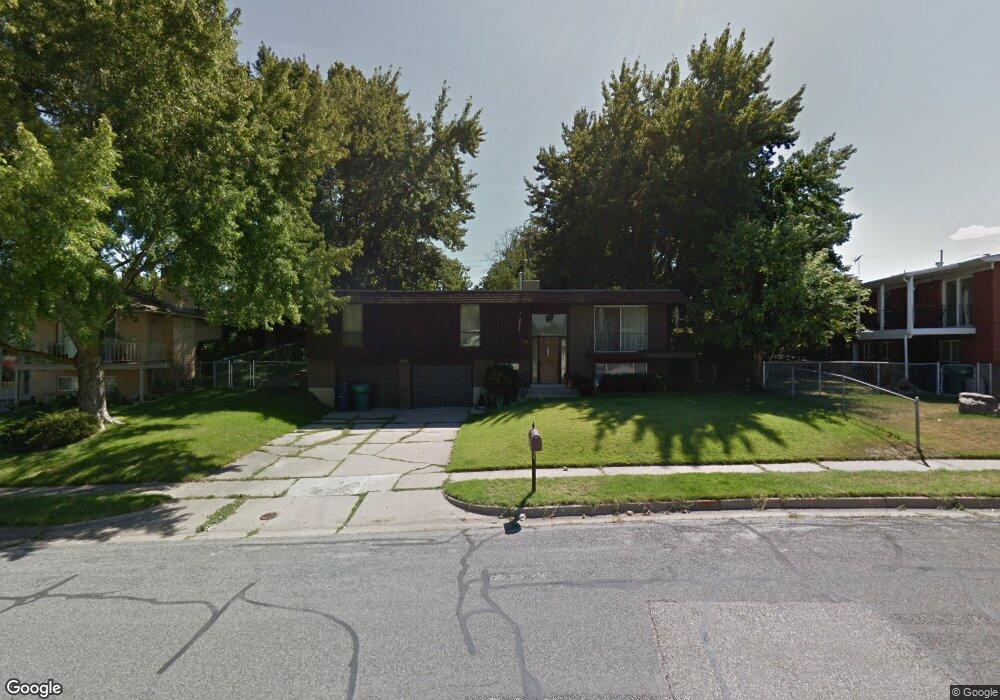
This home is located at 777 E 4500 S, Ogden, UT 84403 and is currently estimated at $432,465, approximately $221 per square foot. 777 E 4500 S is a home located in Weber County with nearby schools including Burch Creek School, South Ogden Junior High School, and Bonneville High School.
Ownership History
We collect this data history from publicly available records. To have your information removed, we recommend requesting removal directly through your county’s website.
Purchase Details
Home Financials for this Owner
Home Financials are based on the most recent Mortgage that was taken out on this home.Purchase Details
Home Financials for this Owner
Home Financials are based on the most recent Mortgage that was taken out on this home.Purchase Details
Home Values in the Area
Average Home Value in this Area
Purchase History
We collect this data history from publicly available records. To have your information removed, we recommend requesting removal directly through your county’s website.
| Date | Buyer | Sale Price | Title Company |
|---|---|---|---|
| -- | Us Title Ins Agency | ||
| -- | Equity Title | ||
| -- | -- |
Mortgage History
We collect this data history from publicly available records. To have your information removed, we recommend requesting removal directly through your county’s website.
| Date | Status | Borrower | Loan Amount |
|---|---|---|---|
| Open | $363,298 | ||
| Previous Owner | $127,988 |
Tax History
We collect this data history from publicly available records. To have your information removed, we recommend requesting removal directly through your county’s website.
| Year | Tax Paid | Tax Assessment Tax Assessment Total Assessment is a certain percentage of the fair market value that is determined by local assessors to be the total taxable value of land and additions on the property. | Land | Improvement |
|---|---|---|---|---|
| 2025 | $3,043 | $427,151 | $151,051 | $276,100 |
| 2024 | $2,988 | $235,399 | $83,078 | $152,321 |
| 2023 | $2,880 | $227,700 | $82,917 | $144,783 |
| 2022 | $2,746 | $223,300 | $80,093 | $143,207 |
| 2021 | $2,125 | $284,000 | $65,556 | $218,444 |
| 2020 | $1,961 | $243,000 | $50,357 | $192,643 |
| 2019 | $1,877 | $221,000 | $45,420 | $175,580 |
| 2018 | $1,695 | $187,000 | $45,420 | $141,580 |
| 2017 | $1,605 | $169,000 | $41,398 | $127,602 |
| 2016 | $1,456 | $84,470 | $19,239 | $65,231 |
| 2015 | $1,479 | $84,470 | $19,239 | $65,231 |
| 2014 | $1,226 | $66,606 | $19,239 | $47,367 |
Map
- 781 Lavina Dr
- 4547 Madison Ave
- 4327 S 900 E
- 796 Nancy Dr
- 4723 Madison Ave
- 4675 Jefferson Ave
- 4625 Porter Ave
- 4685 Porter Ave
- 1113 Country Hills Dr Unit B2
- 1113 Country Hills Dr Unit E1
- 4863 Glasmann Way
- 4840 S 1000 E
- 4851 Kiwana Dr
- 1063 Oxford Dr
- 1091 Country Hills Dr Unit 108
- 4825 Burch Creek Dr
- 4872 Burch Creek Dr
- 1117 Country Hills Dr
- 1025 S Gramercy Ave
- 4079 S 895 E Unit 67
- 4510 S 750 E
- 4510 Country View Dr
- 787 E 4500 S
- 4518 Country View Dr
- 790 Lavina Dr
- 4511 Monroe Blvd
- 794 Lavina Dr
- 784 Lavina Dr
- 772 E 4500 S
- 760 E 4500 S
- 4545 Monroe Blvd
- 784 E 4500 S
- 780 Lavina Dr
- 4526 Country View Dr
- 4515 Country View Dr
- 796 E 4500 S
- 750 E 4500 S
- 774 Lavina Dr
- 4531 Country View Dr
- 4429 Monroe Blvd
Ask me questions while you tour the home.