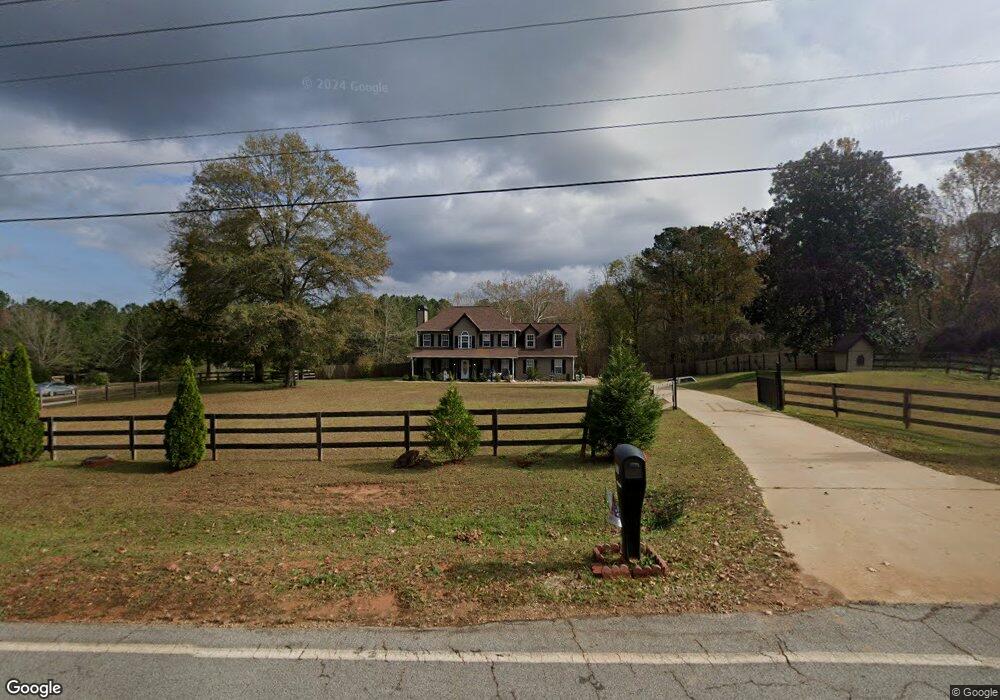
777 John Lovelace Rd Lagrange, GA 30241
Estimated Value: $357,663 - $487,000
4
Beds
3
Baths
2,554
Sq Ft
$158/Sq Ft
Est. Value
About This Home
This home is located at 777 John Lovelace Rd, Lagrange, GA 30241 and is currently estimated at $402,666, approximately $157 per square foot. 777 John Lovelace Rd is a home located in Troup County with nearby schools including Rosemont Elementary School, Whitesville Road Elementary School, and Berta Weathersbee Elementary School.
Ownership History
Date
Name
Owned For
Owner Type
Purchase Details
Closed on
May 24, 2006
Sold by
Braswell James W
Bought by
Gerrish Michael A and Gerrish Patricia A
Current Estimated Value
Purchase Details
Closed on
Nov 22, 2004
Sold by
Braswell James W
Bought by
Alicia James W and Alicia Braswell
Purchase Details
Closed on
Jul 13, 2004
Sold by
Noles Chad B and Noles Dixie B
Bought by
Braswell James W
Purchase Details
Closed on
Jun 29, 2001
Sold by
Jerry Ballard Homes Inc
Bought by
Noles Chad B and Noles Dixie B
Purchase Details
Closed on
Apr 25, 2000
Sold by
Jared T Jones
Bought by
Jerry Ballard Homes Inc
Purchase Details
Closed on
Dec 31, 1999
Sold by
First Flag Bank Lagrange
Bought by
Jared T Jones
Purchase Details
Closed on
Oct 25, 1999
Bought by
First Flag Bank Lagrange
Create a Home Valuation Report for This Property
The Home Valuation Report is an in-depth analysis detailing your home's value as well as a comparison with similar homes in the area
Home Values in the Area
Average Home Value in this Area
Purchase History
| Date | Buyer | Sale Price | Title Company |
|---|---|---|---|
| Gerrish Michael A | $206,000 | -- | |
| Alicia James W | -- | -- | |
| Braswell James W | $170,000 | -- | |
| Noles Chad B | $155,500 | -- | |
| Jerry Ballard Homes Inc | $228,000 | -- | |
| Jared T Jones | -- | -- | |
| First Flag Bank Lagrange | -- | -- |
Source: Public Records
Tax History Compared to Growth
Tax History
| Year | Tax Paid | Tax Assessment Tax Assessment Total Assessment is a certain percentage of the fair market value that is determined by local assessors to be the total taxable value of land and additions on the property. | Land | Improvement |
|---|---|---|---|---|
| 2024 | $11 | $110,272 | $13,760 | $96,512 |
| 2023 | $11 | $110,400 | $13,760 | $96,640 |
| 2022 | $2,749 | $98,480 | $11,000 | $87,480 |
| 2021 | $2,544 | $84,352 | $10,760 | $73,592 |
| 2020 | $2,544 | $84,352 | $10,760 | $73,592 |
| 2019 | $2,357 | $80,128 | $9,400 | $70,728 |
| 2018 | $2,357 | $80,128 | $9,400 | $70,728 |
| 2017 | $2,357 | $80,128 | $9,400 | $70,728 |
| 2016 | $1,959 | $66,950 | $9,900 | $57,050 |
| 2015 | $1,963 | $66,950 | $9,900 | $57,050 |
| 2014 | $1,875 | $63,948 | $9,900 | $54,048 |
| 2013 | -- | $67,118 | $9,900 | $57,218 |
Source: Public Records
Map
Nearby Homes
- 737 John Lovelace Rd
- 356 John Lovelace Rd
- 401 Lower Big Springs Rd Unit LOT 1
- 670 Lower Big Springs Rd
- 2477 Upper Big Springs Rd
- 810 Callaway Church Rd
- 403 Lexington Park Dr
- 137 Robertson Rd
- 138 Hamilton Lake Dr
- 783 Rosemont Rd
- 401 Nashua Dr
- 111 Revere Ct
- 109 Lexington Park Dr
- 130 Hamilton Lake Dr
- 1708 Upper Big Springs Rd Unit 18.93+/- AC
- 111 Hamilton Lake View Ct
- 250 Wilcox Rd
- 107 Beaver Creek Way
- 107 Beaver Creek Way Unit 249
- 105 Beaver Creek Way Unit 248
- 757 John Lovelace Rd
- 780 John Lovelace Rd
- 798 John Lovelace Rd
- 797 John Lovelace Rd
- 760 John Lovelace Rd
- 740 John Lovelace Rd
- 814 John Lovelace Rd
- 807 John Lovelace Rd
- 727 John Lovelace Rd
- 819 John Lovelace Rd
- 720 John Lovelace Rd
- 820 John Lovelace Rd
- 825 John Lovelace Rd
- 717 John Lovelace Rd
- 830 John Lovelace Rd
- 845 John Lovelace Rd Unit 2
- 852 John Lovelace Rd
- 699 John Lovelace Rd
- 865 John Lovelace Rd
- 885 John Lovelace Rd