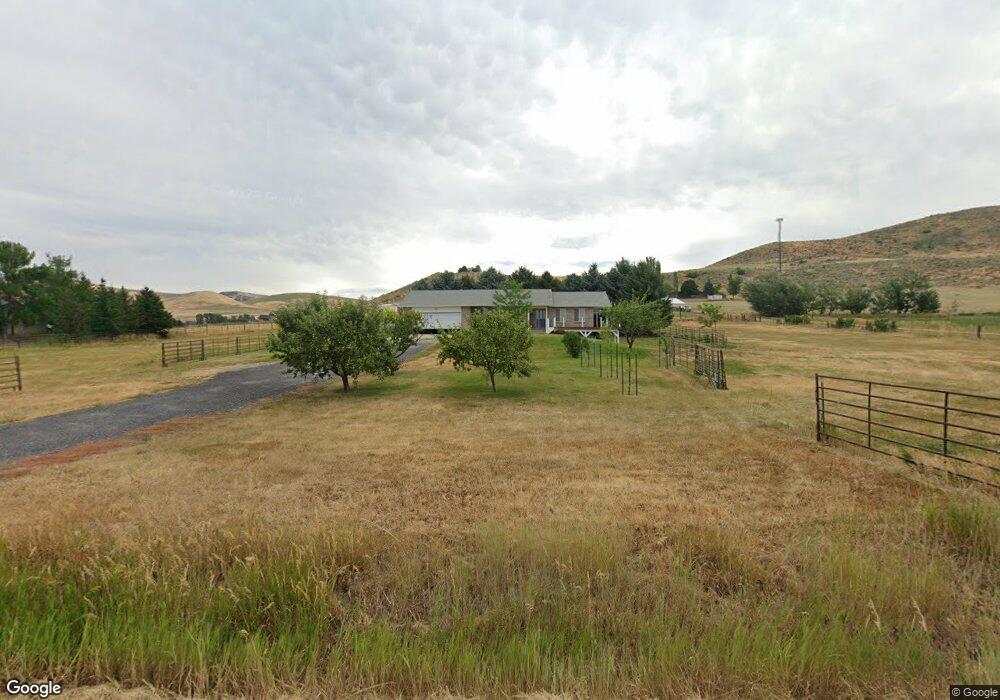
777 S 2600 E Preston, ID 83263
Estimated Value: $524,066 - $708,000
4
Beds
2
Baths
2,357
Sq Ft
$263/Sq Ft
Est. Value
About This Home
This home is located at 777 S 2600 E, Preston, ID 83263 and is currently estimated at $619,017, approximately $262 per square foot. 777 S 2600 E is a home located in Franklin County with nearby schools including Oakwood Elementary School, Pioneer Elementary School, and Preston Junior High School.
Ownership History
Date
Name
Owned For
Owner Type
Purchase Details
Closed on
Nov 23, 2015
Sold by
Hansen Jennie L and Hansen James D
Bought by
Hansen James D and Jennie L Hanse N
Current Estimated Value
Purchase Details
Closed on
May 9, 2012
Sold by
Hansen James D and Hansen Jennie L
Bought by
Hansen Jennie L and Hansen James D
Home Financials for this Owner
Home Financials are based on the most recent Mortgage that was taken out on this home.
Original Mortgage
$141,400
Interest Rate
3.94%
Mortgage Type
New Conventional
Purchase Details
Closed on
May 10, 2005
Sold by
Reese Jon L and Reese Deborah E
Bought by
Hansen James D and Hansen Jennie L
Home Financials for this Owner
Home Financials are based on the most recent Mortgage that was taken out on this home.
Original Mortgage
$152,800
Interest Rate
6.02%
Mortgage Type
New Conventional
Create a Home Valuation Report for This Property
The Home Valuation Report is an in-depth analysis detailing your home's value as well as a comparison with similar homes in the area
Purchase History
| Date | Buyer | Sale Price | Title Company |
|---|---|---|---|
| Hansen James D | -- | None Available | |
| Hansen Jennie L | -- | None Available | |
| Hansen James D | -- | -- |
Source: Public Records
Mortgage History
| Date | Status | Borrower | Loan Amount |
|---|---|---|---|
| Previous Owner | Hansen Jennie L | $141,400 | |
| Previous Owner | Hansen James D | $152,800 |
Source: Public Records
Tax History
| Year | Tax Paid | Tax Assessment Tax Assessment Total Assessment is a certain percentage of the fair market value that is determined by local assessors to be the total taxable value of land and additions on the property. | Land | Improvement |
|---|---|---|---|---|
| 2025 | $1,524 | $422,740 | $105,600 | $317,140 |
| 2024 | $1,574 | $405,898 | $105,600 | $300,298 |
| 2023 | $1,533 | $408,956 | $105,600 | $303,356 |
| 2022 | $1,798 | $361,154 | $57,798 | $303,356 |
| 2021 | $1,666 | $334,424 | $57,798 | $276,626 |
| 2019 | $1,508 | $252,014 | $57,798 | $194,216 |
| 2018 | $1,445 | $236,916 | $42,700 | $194,216 |
| 2017 | $1,518 | $238,829 | $42,700 | $196,129 |
| 2016 | $1,506 | $223,990 | $42,700 | $181,290 |
| 2015 | $1,532 | $224,050 | $42,700 | $181,350 |
| 2014 | $20,593 | $191,960 | $42,700 | $187,860 |
| 2013 | $18,002 | $191,960 | $42,700 | $149,260 |
Source: Public Records
Map
Nearby Homes
- 1164 S 1600 E
- 1128 S 1600 E
- TBD S 1600 E
- North N 2800 E
- 881 S 1200 E
- 1176 E 900 S
- 2214 S 1600 E
- 2214 S 1600 E
- 4200 E Cub River Rd
- Tbd North 2800 E
- 611 N 2200 E Unit 11
- 701 N 2200 E Unit 1
- 602 N 2200 E Unit 2
- 619 E 1st S Unit A/B
- 590 E 1st S Unit A/B
- 557 E 4th N
- 1345 Sugar Factory Rd Unit 4
- 415 E 1st S
- 655 N 8th E
- 2155 N 2200 E
Your Personal Tour Guide
Ask me questions while you tour the home.