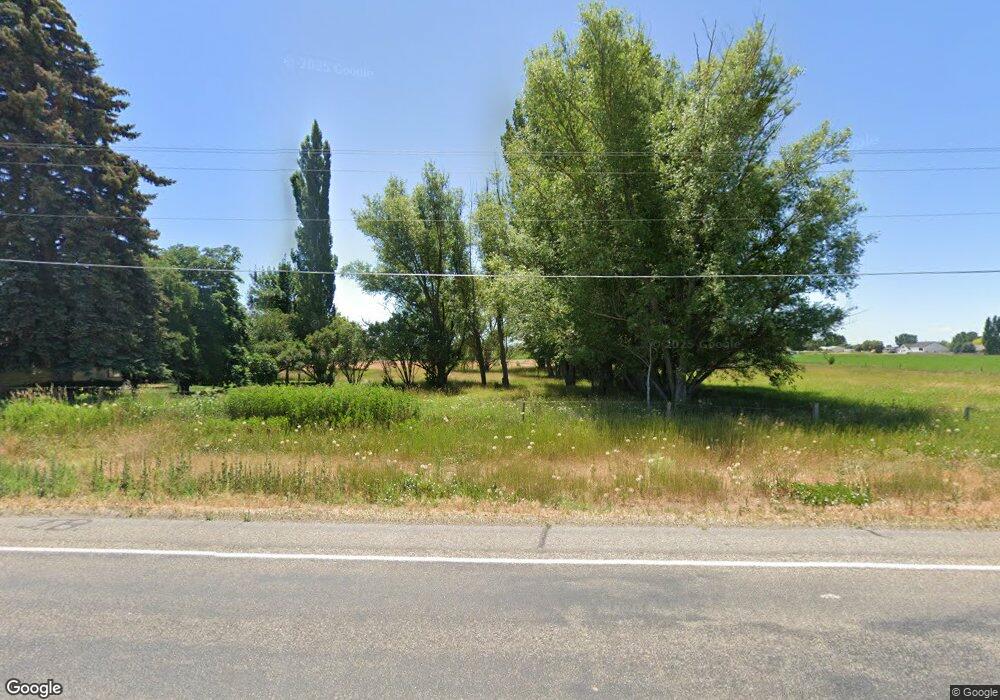
777 W Highway 39 Blackfoot, ID 83221
Estimated Value: $401,000 - $455,000
2
Beds
1
Bath
1,960
Sq Ft
$218/Sq Ft
Est. Value
About This Home
This home is located at 777 W Highway 39, Blackfoot, ID 83221 and is currently estimated at $427,974, approximately $218 per square foot. 777 W Highway 39 is a home located in Bingham County with nearby schools including Riverside Elementary School, Moreland Elementary School, and Rockford Elementary School.
Ownership History
Date
Name
Owned For
Owner Type
Purchase Details
Closed on
Jul 17, 2024
Sold by
Hansen Melvin and Hansen Denise
Bought by
Hansen Melvin and Hansen Denise
Current Estimated Value
Purchase Details
Closed on
Jun 27, 2024
Sold by
Harper Kim
Bought by
Hansen Melvin and Hansen Denise
Purchase Details
Closed on
Dec 4, 2023
Sold by
Hansen Melvin C and Hansen Denise
Bought by
Hansen Melvin and Hansen Denise
Home Financials for this Owner
Home Financials are based on the most recent Mortgage that was taken out on this home.
Original Mortgage
$249,287
Interest Rate
7.79%
Mortgage Type
FHA
Purchase Details
Closed on
May 23, 2011
Sold by
Sims Abner
Bought by
Hansen Melvin C and Hansen Denise
Home Financials for this Owner
Home Financials are based on the most recent Mortgage that was taken out on this home.
Original Mortgage
$111,917
Interest Rate
4.84%
Mortgage Type
New Conventional
Create a Home Valuation Report for This Property
The Home Valuation Report is an in-depth analysis detailing your home's value as well as a comparison with similar homes in the area
Home Values in the Area
Average Home Value in this Area
Purchase History
| Date | Buyer | Sale Price | Title Company |
|---|---|---|---|
| Hansen Melvin | -- | None Listed On Document | |
| Hansen Melvin | -- | None Listed On Document | |
| Hansen Melvin | -- | Empire Title Llc | |
| Hansen Melvin C | -- | -- |
Source: Public Records
Mortgage History
| Date | Status | Borrower | Loan Amount |
|---|---|---|---|
| Previous Owner | Hansen Melvin | $249,287 | |
| Previous Owner | Hansen Melvin C | $111,917 |
Source: Public Records
Tax History Compared to Growth
Tax History
| Year | Tax Paid | Tax Assessment Tax Assessment Total Assessment is a certain percentage of the fair market value that is determined by local assessors to be the total taxable value of land and additions on the property. | Land | Improvement |
|---|---|---|---|---|
| 2025 | $849 | $295,996 | $70,000 | $225,996 |
| 2024 | $849 | $280,573 | $55,000 | $225,573 |
| 2023 | $807 | $281,070 | $55,000 | $226,070 |
| 2022 | $1,439 | $200,991 | $55,000 | $145,991 |
| 2021 | $1,096 | $176,144 | $47,000 | $129,144 |
| 2020 | $1,022 | $148,223 | $0 | $0 |
| 2019 | $1,118 | $148,223 | $0 | $0 |
| 2018 | $1,039 | $126,481 | $34,871 | $91,610 |
| 2017 | $1,009 | $119,481 | $27,871 | $91,610 |
| 2016 | $1,004 | $119,481 | $0 | $0 |
| 2015 | $906 | $119,481 | $0 | $0 |
| 2014 | $906 | $119,481 | $27,871 | $91,610 |
Source: Public Records
Map
Nearby Homes