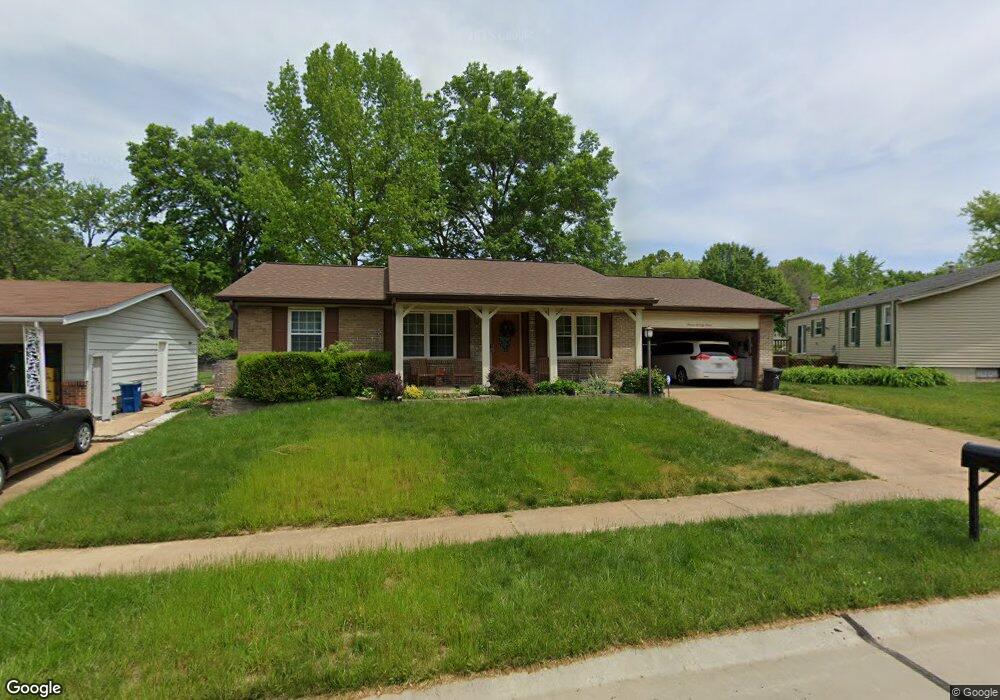
777 Windingpath Ln Ballwin, MO 63021
Estimated Value: $338,187 - $397,000
3
Beds
3
Baths
1,606
Sq Ft
$227/Sq Ft
Est. Value
About This Home
This home is located at 777 Windingpath Ln, Ballwin, MO 63021 and is currently estimated at $364,547, approximately $226 per square foot. 777 Windingpath Ln is a home located in St. Louis County with nearby schools including Hanna Woods Elementary School, Parkway South Middle School, and Parkway South High School.
Ownership History
Date
Name
Owned For
Owner Type
Purchase Details
Closed on
Nov 24, 2010
Sold by
Kumar Narinder and Vaid Veeta
Bought by
Cabanero Latha M
Current Estimated Value
Home Financials for this Owner
Home Financials are based on the most recent Mortgage that was taken out on this home.
Original Mortgage
$132,000
Outstanding Balance
$86,914
Interest Rate
4.23%
Mortgage Type
New Conventional
Estimated Equity
$277,633
Purchase Details
Closed on
Apr 23, 2004
Sold by
Kumar Narinder and Vaid Veeta
Bought by
Kumar Narinder and Vaid Veeta
Home Financials for this Owner
Home Financials are based on the most recent Mortgage that was taken out on this home.
Original Mortgage
$164,905
Interest Rate
5.38%
Mortgage Type
FHA
Purchase Details
Closed on
Oct 31, 2003
Sold by
Bonezek Thomas M
Bought by
Kumar Narinder and Vaid Veeta
Home Financials for this Owner
Home Financials are based on the most recent Mortgage that was taken out on this home.
Original Mortgage
$162,146
Interest Rate
5.99%
Mortgage Type
FHA
Create a Home Valuation Report for This Property
The Home Valuation Report is an in-depth analysis detailing your home's value as well as a comparison with similar homes in the area
Home Values in the Area
Average Home Value in this Area
Purchase History
| Date | Buyer | Sale Price | Title Company |
|---|---|---|---|
| Cabanero Latha M | $165,000 | Ust | |
| Kumar Narinder | -- | -- | |
| Kumar Narinder | $177,500 | -- |
Source: Public Records
Mortgage History
| Date | Status | Borrower | Loan Amount |
|---|---|---|---|
| Open | Cabanero Latha M | $132,000 | |
| Previous Owner | Kumar Narinder | $164,905 | |
| Previous Owner | Kumar Narinder | $162,146 |
Source: Public Records
Tax History
| Year | Tax Paid | Tax Assessment Tax Assessment Total Assessment is a certain percentage of the fair market value that is determined by local assessors to be the total taxable value of land and additions on the property. | Land | Improvement |
|---|---|---|---|---|
| 2025 | $3,806 | $60,500 | $26,600 | $33,900 |
| 2024 | $3,806 | $55,520 | $19,950 | $35,570 |
| 2023 | $3,839 | $55,520 | $19,950 | $35,570 |
| 2022 | $3,740 | $49,720 | $19,950 | $29,770 |
| 2021 | $3,719 | $49,720 | $19,950 | $29,770 |
| 2020 | $3,462 | $44,280 | $16,630 | $27,650 |
| 2019 | $3,402 | $44,280 | $16,630 | $27,650 |
| 2018 | $3,303 | $39,880 | $12,460 | $27,420 |
| 2017 | $3,165 | $39,880 | $12,460 | $27,420 |
| 2016 | $3,111 | $36,430 | $9,980 | $26,450 |
Source: Public Records
Map
Nearby Homes
- 604 Nandale Ln
- 804 Joyceann Dr
- 729 Tuscan Valley Ct
- 821 Courtland Place
- 798 Canary Dr
- 805 Phaeton Dr
- 908 Hanna Rd
- 3 Chappel Ct
- 756 Alexander Mark Way
- 836 Wheelwright Dr
- 514 Meramec Station Rd
- 846 Pheasant Woods Dr
- 408 Saint Lawrence Dr
- 899 Oklahoma Ave
- 1051 Briarhurst Dr
- 401 Hillcrest Blvd
- 313 Saint Lawrence Dr
- 802 Delhurst Dr
- 1131 Westleigh Terrace
- 312 Ballwin Ave
- 773 Windingpath Ln
- 881 Shallowcreek View
- 778 Rockridge Dr
- 770 Rockridge Dr
- 767 Windingpath Ln
- 776 Windingpath Ln
- 766 Rockridge Dr
- 873 Shallowcreek View
- 763 Windingpath Ln
- 760 Rockridge Dr
- 882 Shallowcreek View
- 762 Windingpath Ln
- 768 Shallowcreek View
- 876 Shallowcreek View
- 756 Rockridge Dr
- 775 Rockridge Dr
- 779 Rockridge Dr
- 769 Rockridge Dr
- 759 Windingpath Ln
- 872 Shallowcreek View
Your Personal Tour Guide
Ask me questions while you tour the home.