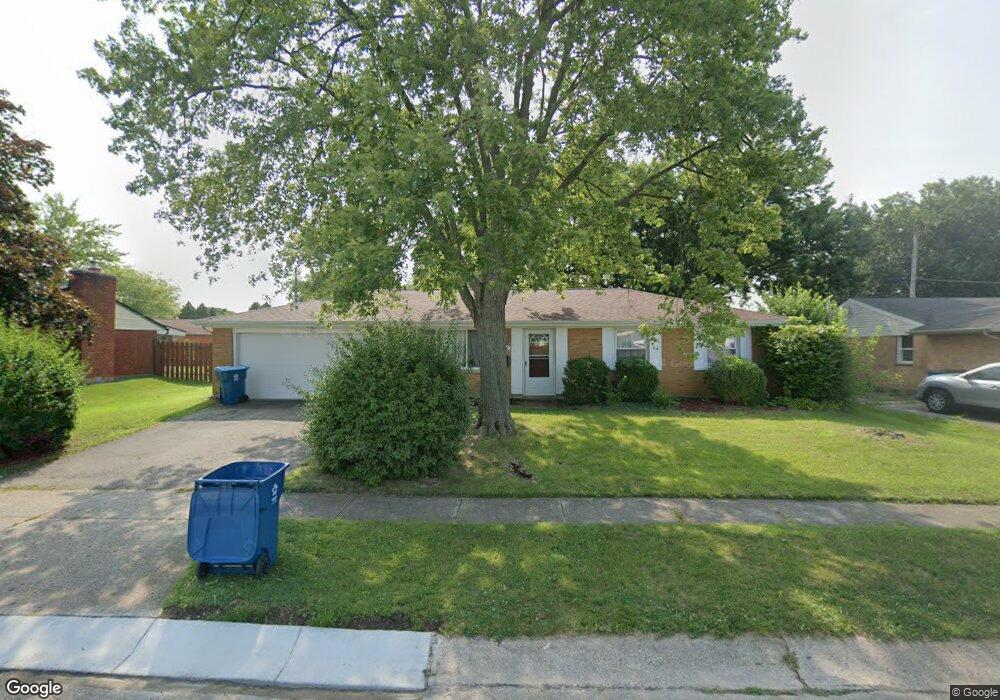
7770 Remmick Ln Dayton, OH 45424
Estimated Value: $177,000 - $200,000
3
Beds
2
Baths
1,026
Sq Ft
$186/Sq Ft
Est. Value
About This Home
This home is located at 7770 Remmick Ln, Dayton, OH 45424 and is currently estimated at $190,721, approximately $185 per square foot. 7770 Remmick Ln is a home located in Montgomery County with nearby schools including Wayne High School and Huber Heights Christian Academy.
Ownership History
Date
Name
Owned For
Owner Type
Purchase Details
Closed on
Oct 27, 2020
Sold by
Leach Lori K and Villegas Juani
Bought by
Ray Sean Collin
Current Estimated Value
Home Financials for this Owner
Home Financials are based on the most recent Mortgage that was taken out on this home.
Original Mortgage
$132,990
Outstanding Balance
$118,342
Interest Rate
2.8%
Mortgage Type
VA
Estimated Equity
$72,379
Purchase Details
Closed on
Jan 14, 2002
Sold by
Lee Werling David
Bought by
Leach Lori K and Villegas Juani
Home Financials for this Owner
Home Financials are based on the most recent Mortgage that was taken out on this home.
Original Mortgage
$50,100
Interest Rate
7.07%
Purchase Details
Closed on
Dec 10, 2001
Sold by
Lee Werling David
Bought by
Leach Lori K and Villegas Juani
Home Financials for this Owner
Home Financials are based on the most recent Mortgage that was taken out on this home.
Original Mortgage
$50,100
Interest Rate
7.07%
Create a Home Valuation Report for This Property
The Home Valuation Report is an in-depth analysis detailing your home's value as well as a comparison with similar homes in the area
Home Values in the Area
Average Home Value in this Area
Purchase History
| Date | Buyer | Sale Price | Title Company |
|---|---|---|---|
| Ray Sean Collin | $130,000 | Sterling Land Title Agcy Inc | |
| Leach Lori K | $55,700 | -- | |
| Leach Lori K | $55,700 | -- |
Source: Public Records
Mortgage History
| Date | Status | Borrower | Loan Amount |
|---|---|---|---|
| Open | Ray Sean Collin | $132,990 | |
| Previous Owner | Leach Lori K | $50,100 |
Source: Public Records
Tax History Compared to Growth
Tax History
| Year | Tax Paid | Tax Assessment Tax Assessment Total Assessment is a certain percentage of the fair market value that is determined by local assessors to be the total taxable value of land and additions on the property. | Land | Improvement |
|---|---|---|---|---|
| 2024 | $2,444 | $47,280 | $10,150 | $37,130 |
| 2023 | $2,444 | $47,280 | $10,150 | $37,130 |
| 2022 | $2,132 | $32,570 | $7,000 | $25,570 |
| 2021 | $2,224 | $32,570 | $7,000 | $25,570 |
| 2020 | $2,170 | $32,570 | $7,000 | $25,570 |
| 2019 | $2,267 | $29,350 | $7,000 | $22,350 |
| 2018 | $2,274 | $29,350 | $7,000 | $22,350 |
| 2017 | $2,261 | $29,350 | $7,000 | $22,350 |
| 2016 | $2,150 | $27,170 | $7,000 | $20,170 |
| 2015 | $2,123 | $27,170 | $7,000 | $20,170 |
| 2014 | $2,123 | $27,170 | $7,000 | $20,170 |
| 2012 | -- | $29,690 | $8,750 | $20,940 |
Source: Public Records
Map
Nearby Homes
- 6681 Spokane Dr
- 6701 Springport Way
- 7866 Harshmanville Rd
- 7854 Harshmanville Rd
- 7833 Harshmanville Rd
- 7741 Shalamar Dr
- 6605 Highbury Rd
- 7371 Damascus Dr
- 6447 Highbury Rd
- 8282 Briar Ridge Ct
- 7660 Stonecrest Dr
- 7611 Shepherdess Dr
- 6150 Taylorsville Rd
- 6601 Grovehill Dr
- 6811 Highbury Rd
- 7150 Harshmanville Rd
- 7011 Safari Dr
- 7211 Stonehurst Dr
- 6960 Serene Place
- 7221 Serpentine Dr
- 7760 Remmick Ln
- 7780 Remmick Ln
- 7751 Rothfield Dr
- 6510 Stonehurst Dr
- 7750 Remmick Ln
- 7741 Rothfield Dr
- 7821 Redbank Ln
- 6460 Stonehurst Dr
- 7761 Rothfield Dr
- 6520 Stonehurst Dr
- 7740 Remmick Ln
- 7731 Rothfield Dr
- 6501 Stonehurst Dr
- 6467 Stonehurst Dr
- 6450 Stonehurst Dr
- 7820 Redbank Ln
- 6530 Stonehurst Dr
- 7771 Rothfield Dr
- 6455 Stonehurst Dr
- 7750 Rothfield Dr