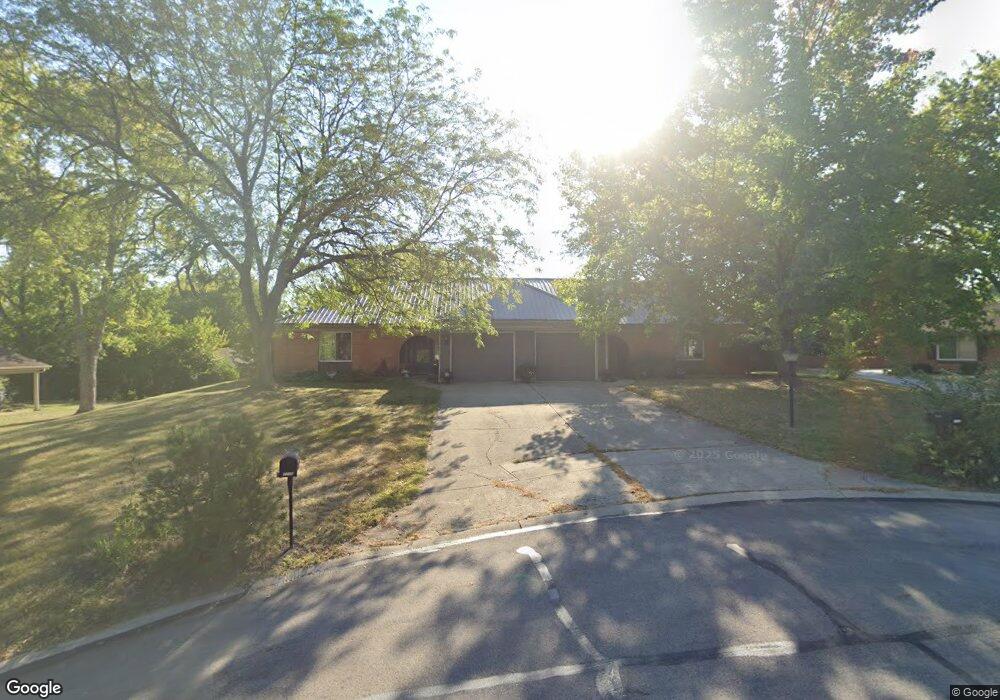
7772 Obrian Place Dayton, OH 45459
Estimated Value: $320,000 - $458,000
2
Beds
2
Baths
2,466
Sq Ft
$151/Sq Ft
Est. Value
About This Home
This home is located at 7772 Obrian Place, Dayton, OH 45459 and is currently estimated at $373,108, approximately $151 per square foot. 7772 Obrian Place is a home located in Montgomery County with nearby schools including Primary Village North, Stingley Elementary School, and Tower Heights Middle School.
Ownership History
Date
Name
Owned For
Owner Type
Purchase Details
Closed on
Feb 13, 2021
Sold by
Schrock Kevin M and Schrock Jayme Keyes
Bought by
10 10 Investments Llc
Current Estimated Value
Purchase Details
Closed on
Jun 14, 2016
Sold by
Kfp Partners
Bought by
Schrock Kevin M and Schrock Jayme Keyes
Home Financials for this Owner
Home Financials are based on the most recent Mortgage that was taken out on this home.
Original Mortgage
$138,750
Interest Rate
3.57%
Mortgage Type
New Conventional
Purchase Details
Closed on
Oct 3, 2000
Sold by
Peggy Gribben
Bought by
Kfp Partners
Home Financials for this Owner
Home Financials are based on the most recent Mortgage that was taken out on this home.
Original Mortgage
$150,000
Interest Rate
7.96%
Mortgage Type
Purchase Money Mortgage
Create a Home Valuation Report for This Property
The Home Valuation Report is an in-depth analysis detailing your home's value as well as a comparison with similar homes in the area
Home Values in the Area
Average Home Value in this Area
Purchase History
| Date | Buyer | Sale Price | Title Company |
|---|---|---|---|
| 10 10 Investments Llc | -- | Landmark Ttl Agcy South Inc | |
| Schrock Kevin M | $185,000 | Landmark Title Agency South | |
| Kfp Partners | $160,000 | -- |
Source: Public Records
Mortgage History
| Date | Status | Borrower | Loan Amount |
|---|---|---|---|
| Previous Owner | Schrock Kevin M | $138,750 | |
| Previous Owner | Kfp Partners | $150,000 |
Source: Public Records
Tax History Compared to Growth
Tax History
| Year | Tax Paid | Tax Assessment Tax Assessment Total Assessment is a certain percentage of the fair market value that is determined by local assessors to be the total taxable value of land and additions on the property. | Land | Improvement |
|---|---|---|---|---|
| 2024 | $5,946 | $99,880 | $21,740 | $78,140 |
| 2023 | $5,946 | $99,880 | $21,740 | $78,140 |
| 2022 | $5,433 | $72,340 | $15,750 | $56,590 |
| 2021 | $5,447 | $72,340 | $15,750 | $56,590 |
| 2020 | $5,440 | $72,340 | $15,750 | $56,590 |
| 2019 | $5,311 | $63,030 | $15,750 | $47,280 |
| 2018 | $4,723 | $63,030 | $15,750 | $47,280 |
| 2017 | $4,674 | $63,030 | $15,750 | $47,280 |
| 2016 | $4,517 | $57,480 | $15,750 | $41,730 |
| 2015 | $4,472 | $57,480 | $15,750 | $41,730 |
| 2014 | $4,472 | $57,480 | $15,750 | $41,730 |
| 2012 | -- | $76,010 | $17,500 | $58,510 |
Source: Public Records
Map
Nearby Homes
- 7820 Raintree Rd
- 7308 Tamarind Trail
- 7215 Whitetail Trail Unit 108108
- 7124 Fallen Oak Trace Unit 420
- 7129 Fallen Oak Trace Unit 839
- 7128 Hartcrest Ln Unit 130130
- 7128 Hartcrest Ln Unit 130
- 7111 Fallen Oak Trace Unit 1050
- 1563 Langdon Dr
- 7720 Park Creek Dr
- 311 Pleasant Hill Dr
- 121 Woodfield Place
- 129 Bradstreet Rd
- 40 Cemetery Dr
- 1310 Hollow Run Unit 3
- 1511 Lake Pointe Way
- 1511 Lake Pointe Way Unit 2
- 8580 Hide a Way Ln
- 85 Poinciana Dr
- 1311 Hollow Run Unit 11
- 7770 Obrian Place
- 7760 Obrian Place
- 1370 Black Oak Dr
- 7797 Raintree Rd
- 7791 Raintree Rd
- 7771 Obrian Place
- 1250 Black Oak Dr
- 7800 Millerton Dr
- 7795 Raintree Rd
- 1230 Black Oak Dr
- 1355 Black Oak Dr
- 1375 Black Oak Dr
- 1345 Black Oak Dr
- 7770 Sterling Place
- 7772 Sterling Place
- 7810 Millerton Dr
- 1365 Black Oak Dr
- 1021 Millerton Dr
- 7798 Raintree Rd
- 1335 Black Oak Dr