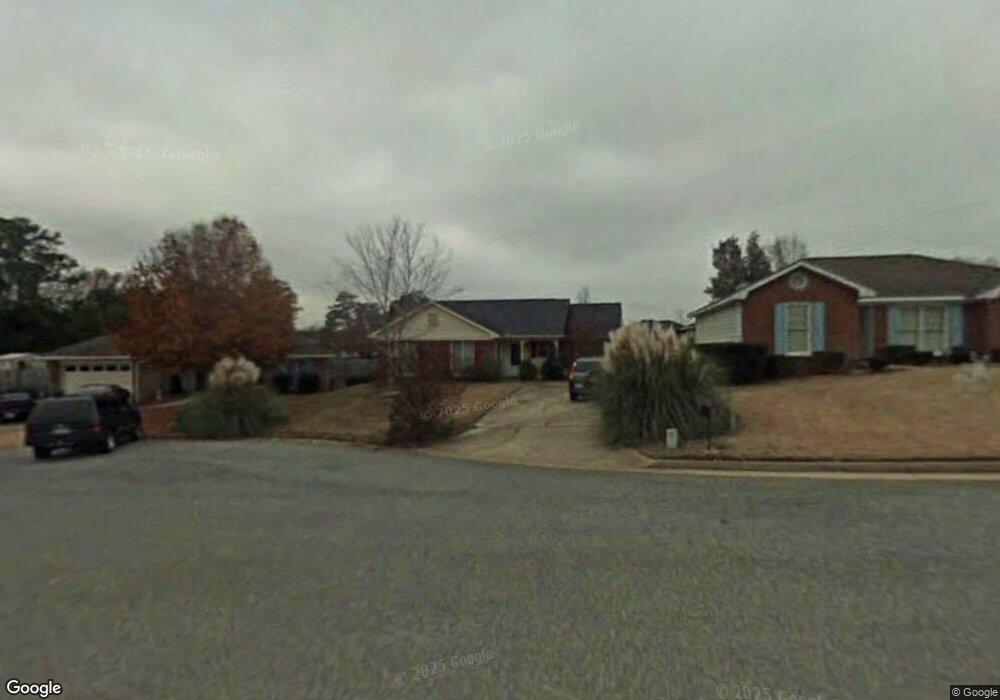
7775 Birchwood Ct Columbus, GA 31909
Northern Columbus NeighborhoodEstimated Value: $222,000 - $234,000
3
Beds
3
Baths
1,441
Sq Ft
$157/Sq Ft
Est. Value
About This Home
This home is located at 7775 Birchwood Ct, Columbus, GA 31909 and is currently estimated at $226,871, approximately $157 per square foot. 7775 Birchwood Ct is a home located in Muscogee County with nearby schools including North Columbus Elementary School, Veterans Memorial Middle School, and Northside High School.
Ownership History
Date
Name
Owned For
Owner Type
Purchase Details
Closed on
Mar 30, 2017
Sold by
Johnson Robert S
Bought by
Yoon Jeong Kerry
Current Estimated Value
Home Financials for this Owner
Home Financials are based on the most recent Mortgage that was taken out on this home.
Original Mortgage
$136,972
Outstanding Balance
$113,636
Interest Rate
4.1%
Mortgage Type
FHA
Estimated Equity
$113,235
Purchase Details
Closed on
Oct 28, 2014
Sold by
Johnson Brandon Paul
Bought by
Johnson Robert S
Home Financials for this Owner
Home Financials are based on the most recent Mortgage that was taken out on this home.
Original Mortgage
$129,326
Interest Rate
4.09%
Mortgage Type
VA
Purchase Details
Closed on
Jan 15, 2010
Sold by
Johnson Brandon Paul
Bought by
Johnson Robert S
Home Financials for this Owner
Home Financials are based on the most recent Mortgage that was taken out on this home.
Original Mortgage
$133,250
Interest Rate
4.94%
Mortgage Type
VA
Create a Home Valuation Report for This Property
The Home Valuation Report is an in-depth analysis detailing your home's value as well as a comparison with similar homes in the area
Home Values in the Area
Average Home Value in this Area
Purchase History
| Date | Buyer | Sale Price | Title Company |
|---|---|---|---|
| Yoon Jeong Kerry | $139,500 | -- | |
| Johnson Robert S | -- | -- | |
| Johnson Robert S | -- | None Available |
Source: Public Records
Mortgage History
| Date | Status | Borrower | Loan Amount |
|---|---|---|---|
| Open | Yoon Jeong Kerry | $136,972 | |
| Previous Owner | Johnson Robert S | $129,326 | |
| Previous Owner | Johnson Robert S | $133,250 |
Source: Public Records
Tax History Compared to Growth
Tax History
| Year | Tax Paid | Tax Assessment Tax Assessment Total Assessment is a certain percentage of the fair market value that is determined by local assessors to be the total taxable value of land and additions on the property. | Land | Improvement |
|---|---|---|---|---|
| 2025 | $1,501 | $63,512 | $10,656 | $52,856 |
| 2024 | $1,500 | $63,512 | $10,656 | $52,856 |
| 2023 | $815 | $63,512 | $10,656 | $52,856 |
| 2022 | $1,564 | $53,748 | $10,656 | $43,092 |
| 2021 | $1,557 | $51,528 | $10,656 | $40,872 |
| 2020 | $1,558 | $51,528 | $10,656 | $40,872 |
| 2019 | $1,564 | $51,528 | $10,656 | $40,872 |
| 2018 | $2,111 | $51,528 | $10,656 | $40,872 |
| 2017 | $2,118 | $51,528 | $10,656 | $40,872 |
| 2016 | $2,170 | $52,600 | $6,391 | $46,209 |
| 2015 | $1,283 | $52,600 | $6,391 | $46,209 |
| 2014 | $1,283 | $52,600 | $6,391 | $46,209 |
| 2013 | -- | $52,600 | $6,391 | $46,209 |
Source: Public Records
Map
Nearby Homes
- 1727 Fountain Ct
- 1719 Double Churches Rd
- 7407 Peppercorn Dr
- 7559 Crescent Dr
- 7995 Big Creek Place
- 1535 Doubletree Dr
- 1438 Grove Park Dr Unit 13B
- 7313 Sesame St
- 1579 Magnolia Way
- 8008 Lagoon Ct
- 18 Peppertree Ct
- 7185 Helen Dr
- 8300 Fortson Rd
- 1512 Tom Buk Tu Ln
- 8350 Fortson Rd
- 7170 Bridgemill Dr
- 8217 Remey Dr
- 1058 Cedarbrook Dr
- 1355 Cloverdale Rd
- 8344 Twin Chapel Dr
- 7779 Birchwood Ct
- 7771 Birchwood Ct
- 2254 Birchwood Dr
- 2246 Birchwood Dr
- 2238 Birchwood Dr
- 2242 Birchwood Dr
- 7767 Birchwood Ct
- 7766 Birchwood Ct
- 7778 Birchwood Ct
- 7774 Birchwood Ct
- 2234 Birchwood Dr
- 2239 Birchwood Dr
- 2251 Birchwood Dr
- 2255 Birchwood Dr
- 2247 Birchwood Dr
- 2259 Birchwood Dr
- 2235 Birchwood Dr
- 7770 Birchwood Ct
- 2263 Birchwood Dr
- 2243 Birchwood Dr