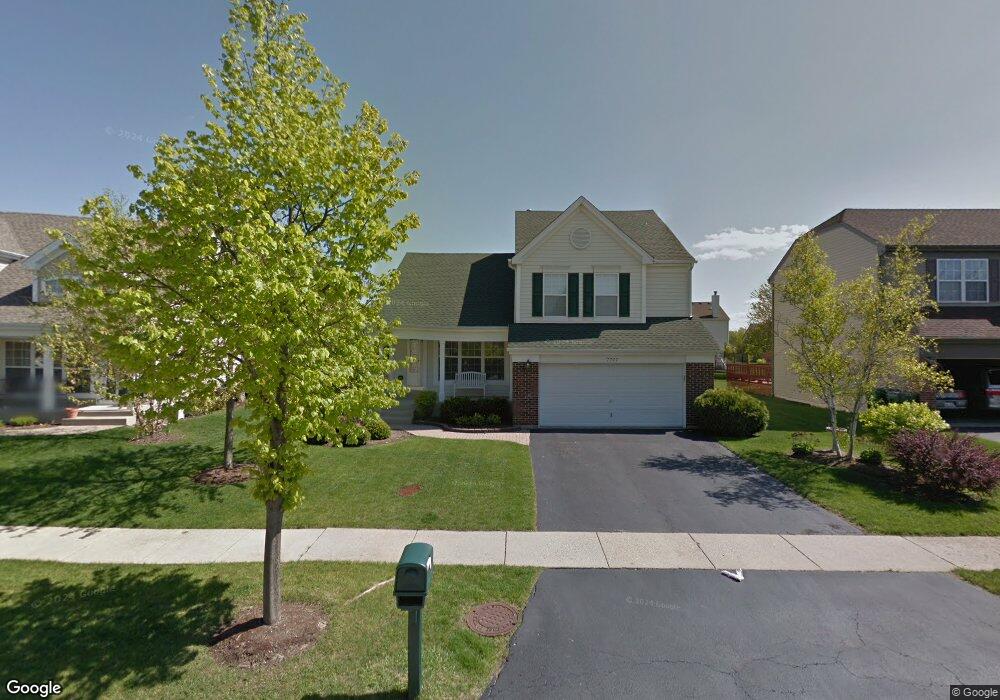
7777 Geneva Dr Gurnee, IL 60031
Estimated Value: $367,609 - $404,000
3
Beds
3
Baths
1,692
Sq Ft
$228/Sq Ft
Est. Value
About This Home
This home is located at 7777 Geneva Dr, Gurnee, IL 60031 and is currently estimated at $386,402, approximately $228 per square foot. 7777 Geneva Dr is a home located in Lake County with nearby schools including Woodland Primary School, Woodland Elementary School, and Woodland Intermediate School.
Ownership History
Date
Name
Owned For
Owner Type
Purchase Details
Closed on
Jan 12, 2005
Sold by
Hubbell William S and Hubbell Patrice S
Bought by
Mceachin Stevens L and Mceachin Lisa D
Current Estimated Value
Home Financials for this Owner
Home Financials are based on the most recent Mortgage that was taken out on this home.
Original Mortgage
$195,000
Outstanding Balance
$98,583
Interest Rate
5.77%
Mortgage Type
Purchase Money Mortgage
Estimated Equity
$287,819
Purchase Details
Closed on
Jun 29, 1994
Sold by
Sundance Holdings Inc
Bought by
Hubbell William S and Hubbell Patrice S
Home Financials for this Owner
Home Financials are based on the most recent Mortgage that was taken out on this home.
Original Mortgage
$149,800
Interest Rate
7.25%
Create a Home Valuation Report for This Property
The Home Valuation Report is an in-depth analysis detailing your home's value as well as a comparison with similar homes in the area
Home Values in the Area
Average Home Value in this Area
Purchase History
| Date | Buyer | Sale Price | Title Company |
|---|---|---|---|
| Mceachin Stevens L | $286,000 | First American Title | |
| Hubbell William S | $168,000 | -- |
Source: Public Records
Mortgage History
| Date | Status | Borrower | Loan Amount |
|---|---|---|---|
| Open | Mceachin Stevens L | $195,000 | |
| Previous Owner | Hubbell William S | $149,800 |
Source: Public Records
Tax History
| Year | Tax Paid | Tax Assessment Tax Assessment Total Assessment is a certain percentage of the fair market value that is determined by local assessors to be the total taxable value of land and additions on the property. | Land | Improvement |
|---|---|---|---|---|
| 2024 | $8,221 | $98,727 | $19,105 | $79,622 |
| 2023 | $7,943 | $91,660 | $17,737 | $73,923 |
| 2022 | $7,943 | $87,491 | $17,742 | $69,749 |
| 2021 | $7,174 | $83,980 | $17,030 | $66,950 |
| 2020 | $6,939 | $81,915 | $16,611 | $65,304 |
| 2019 | $6,739 | $79,537 | $16,129 | $63,408 |
| 2018 | $6,360 | $76,332 | $16,961 | $59,371 |
| 2017 | $6,290 | $74,145 | $16,475 | $57,670 |
| 2016 | $6,233 | $70,843 | $15,741 | $55,102 |
| 2015 | $6,061 | $67,188 | $14,929 | $52,259 |
| 2014 | $5,747 | $64,412 | $14,715 | $49,697 |
| 2012 | $5,452 | $64,906 | $14,828 | $50,078 |
Source: Public Records
Map
Nearby Homes
- 528 Cliffwood Ln
- 415 Kingsport Dr
- 7817 Cascade Way
- 18500 W Aspen Ct
- 7449 Brentwood Ln
- 7421 Prescott Ln
- 18224 W Old Pine Ct
- 18184 W Old Pine Ct
- 34271 N Tangueray Dr
- 767 Aster Dr
- 968 Knowles Rd
- 1094 Vista Dr
- 1107 Vineyard Dr
- 7390 Bittersweet Dr
- 11 Spinnaker Ct
- 1158 Vista Dr
- 34115 N Wooded Glen Dr
- 701 Caitlin Ct
- 18238 W Gages Lake Rd
- 498 Capital Ln
- 7783 Geneva Dr
- 7771 Geneva Dr
- 7770 Milan Way
- 7789 Geneva Dr
- 7764 Milan Way
- 7765 Geneva Dr
- 7776 Milan Way
- 7758 Milan Way Unit 2
- 471 Crystal Place
- 7811 Geneva Dr
- 7759 Geneva Dr
- 7752 Milan Way
- 7784 Geneva Dr
- 7823 Geneva Dr
- 483 Crystal Place
- 7746 Milan Way
- 7753 Geneva Dr
- 7752 Geneva Dr
- 7790 Geneva Dr
- 7740 Milan Way
Your Personal Tour Guide
Ask me questions while you tour the home.