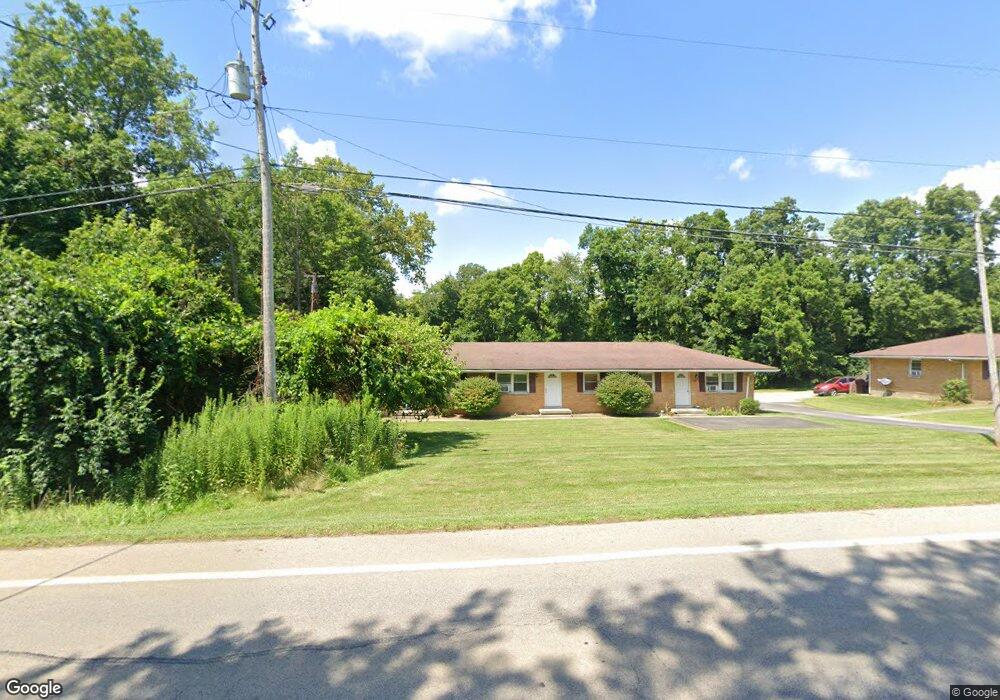
7777 State Route 48 Unit 3 Waynesville, OH 45068
Clearcreek Township NeighborhoodEstimated Value: $311,000 - $361,000
2
Beds
1
Bath
750
Sq Ft
$448/Sq Ft
Est. Value
About This Home
This home is located at 7777 State Route 48 Unit 3, Waynesville, OH 45068 and is currently estimated at $336,000, approximately $448 per square foot. 7777 State Route 48 Unit 3 is a home located in Warren County with nearby schools including Clearcreek Elementary School, Springboro Intermediate School, and Springboro Junior High School.
Ownership History
Date
Name
Owned For
Owner Type
Purchase Details
Closed on
Oct 3, 2025
Sold by
Geraci Joseph R
Bought by
Springboro Rentals Llc
Current Estimated Value
Purchase Details
Closed on
Nov 23, 2016
Sold by
Springboro Rentals Llc and Geraci Joseph R
Bought by
Geraci Joseph R
Purchase Details
Closed on
Oct 19, 2016
Sold by
Geraci Joseph R
Bought by
Springboro Property Llc
Purchase Details
Closed on
Mar 7, 2016
Sold by
Springboro Rentals Llc
Bought by
Geraci Joseph R
Purchase Details
Closed on
Jan 25, 2006
Sold by
Geraci Joseph R
Bought by
Springboro Rentals Llc
Home Financials for this Owner
Home Financials are based on the most recent Mortgage that was taken out on this home.
Original Mortgage
$161,250
Interest Rate
6.34%
Mortgage Type
Fannie Mae Freddie Mac
Purchase Details
Closed on
Dec 9, 2005
Sold by
Geraci Joseph R
Bought by
Springboro Rentals Llc
Home Financials for this Owner
Home Financials are based on the most recent Mortgage that was taken out on this home.
Original Mortgage
$161,250
Interest Rate
6.34%
Mortgage Type
Fannie Mae Freddie Mac
Create a Home Valuation Report for This Property
The Home Valuation Report is an in-depth analysis detailing your home's value as well as a comparison with similar homes in the area
Home Values in the Area
Average Home Value in this Area
Purchase History
| Date | Buyer | Sale Price | Title Company |
|---|---|---|---|
| Springboro Rentals Llc | -- | None Listed On Document | |
| Geraci Joseph R | $16,667 | None Available | |
| Springboro Property Llc | -- | None Available | |
| Geraci Joseph R | -- | None Available | |
| Springboro Rentals Llc | -- | Middletown Title Agency | |
| Geraci Joseph R | -- | Middletown Title | |
| Springboro Rentals Llc | -- | -- |
Source: Public Records
Mortgage History
| Date | Status | Borrower | Loan Amount |
|---|---|---|---|
| Previous Owner | Geraci Joseph R | $161,250 |
Source: Public Records
Tax History Compared to Growth
Tax History
| Year | Tax Paid | Tax Assessment Tax Assessment Total Assessment is a certain percentage of the fair market value that is determined by local assessors to be the total taxable value of land and additions on the property. | Land | Improvement |
|---|---|---|---|---|
| 2024 | $3,847 | $91,930 | $20,120 | $71,810 |
| 2023 | $3,325 | $74,854 | $11,249 | $63,605 |
| 2022 | $3,337 | $74,855 | $11,249 | $63,606 |
| 2021 | $3,139 | $74,855 | $11,249 | $63,606 |
| 2020 | $2,941 | $60,858 | $9,146 | $51,713 |
| 2019 | $2,742 | $60,858 | $9,146 | $51,713 |
| 2018 | $2,733 | $60,858 | $9,146 | $51,713 |
| 2017 | $2,588 | $51,699 | $7,903 | $43,796 |
| 2016 | $2,693 | $51,699 | $7,903 | $43,796 |
| 2015 | $2,690 | $51,699 | $7,903 | $43,796 |
| 2014 | $2,662 | $48,310 | $7,390 | $40,930 |
| 2013 | $2,662 | $59,840 | $9,150 | $50,690 |
Source: Public Records
Map
Nearby Homes
- 1744 Harlan Rd
- 0 Voltaire Ct Unit 1863060
- 8234 Voltaire Ct
- 7510 Country Brook Ct
- 7491 Country Brook Ct
- 0 White Cedar Way Unit 1818661
- 710 White Cedar Way
- 441 Ohio 73
- 441 E State Route 73
- 8670 Hawthorne Place
- 639 Birchcreek Way
- 2693 Ohio 73
- 7940 Bunnell Hill Rd
- Esquire Place Plan at Copper Mill
- Normandy Estate Plan at Copper Mill
- Cumberland Estate Plan at Copper Mill
- Corsica Estate Plan at Copper Mill
- Versailles Estate Plan at Copper Mill
- Saint Lawrence Estate Plan at Copper Mill
- 1241 Normandy Rue
- 7777 State Route 48
- 7797 State Route 48
- 1450 Timber Ridge Ct
- 7815 State Route 48
- 7792 State Route 48
- 7792 State Route 48
- 7815 Ohio 48
- 7750 State Route 48
- 7820 State Route 48
- 1461 Center Spring Ave
- 7792 St Rt 48
- 1414 Timber Ridge Ct
- 1525 Harlan Rd
- 7730 State Route 48
- 1351 Center Spring Ave
- 1325 Center Spring Ave
- 1563 Harlan Rd
- 1540 Harlan Rd
- 1399 Timber Ridge Ct
- 1360 Timber Ridge Ct