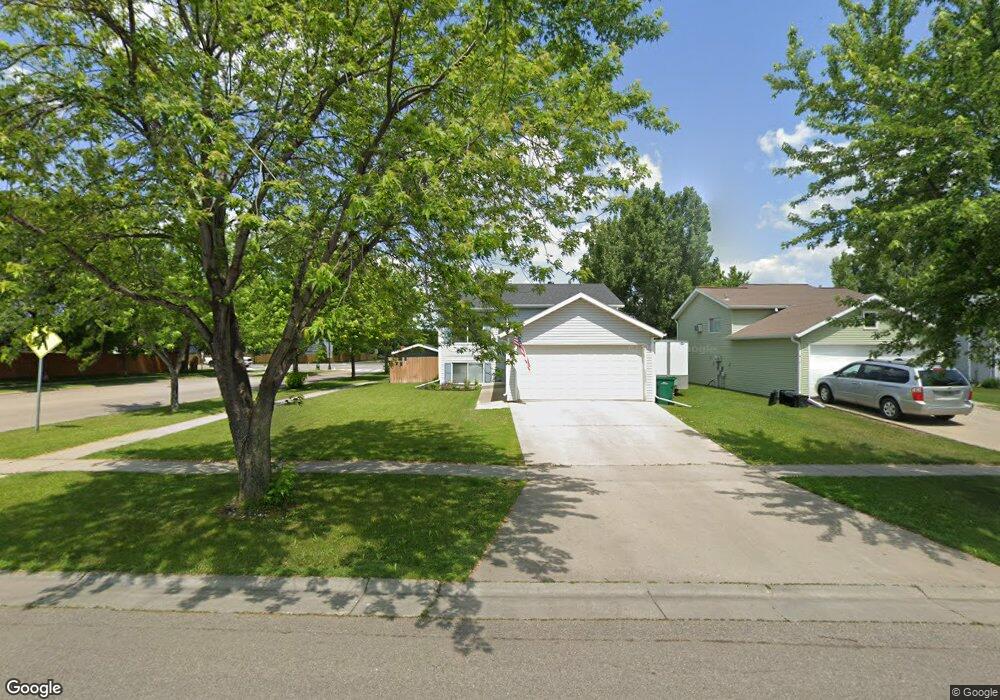
778 14th Ave W West Fargo, ND 58078
Sheyenne Park NeighborhoodEstimated Value: $276,000 - $276,084
4
Beds
2
Baths
1,692
Sq Ft
$163/Sq Ft
Est. Value
About This Home
This home is located at 778 14th Ave W, West Fargo, ND 58078 and is currently estimated at $276,042, approximately $163 per square foot. 778 14th Ave W is a home located in Cass County with nearby schools including Westside Elementary School, Cheney Middle School, and West Fargo High School.
Ownership History
Date
Name
Owned For
Owner Type
Purchase Details
Closed on
Apr 24, 2020
Sold by
Meyer John J and Meyer Jodi L
Bought by
Simenson Sadie and Simenson Matthew
Current Estimated Value
Home Financials for this Owner
Home Financials are based on the most recent Mortgage that was taken out on this home.
Original Mortgage
$186,459
Outstanding Balance
$164,866
Interest Rate
3.3%
Mortgage Type
New Conventional
Estimated Equity
$111,176
Purchase Details
Closed on
May 5, 2017
Sold by
Bahls Callie M
Bought by
Meyer John J and Meyer Jodi L
Home Financials for this Owner
Home Financials are based on the most recent Mortgage that was taken out on this home.
Original Mortgage
$115,000
Interest Rate
4.14%
Mortgage Type
Credit Line Revolving
Purchase Details
Closed on
Feb 25, 2011
Sold by
Engen Michael Scott and Engen Diane Kay
Bought by
Bjornholt Ashley A
Create a Home Valuation Report for This Property
The Home Valuation Report is an in-depth analysis detailing your home's value as well as a comparison with similar homes in the area
Home Values in the Area
Average Home Value in this Area
Purchase History
| Date | Buyer | Sale Price | Title Company |
|---|---|---|---|
| Simenson Sadie | $189,900 | Fm Title | |
| Meyer John J | $170,000 | Fm Title | |
| Bjornholt Ashley A | -- | -- |
Source: Public Records
Mortgage History
| Date | Status | Borrower | Loan Amount |
|---|---|---|---|
| Open | Simenson Sadie | $186,459 | |
| Previous Owner | Meyer John J | $115,000 |
Source: Public Records
Tax History Compared to Growth
Tax History
| Year | Tax Paid | Tax Assessment Tax Assessment Total Assessment is a certain percentage of the fair market value that is determined by local assessors to be the total taxable value of land and additions on the property. | Land | Improvement |
|---|---|---|---|---|
| 2024 | $2,817 | $108,300 | $21,100 | $87,200 |
| 2023 | $3,305 | $107,500 | $21,100 | $86,400 |
| 2022 | $3,268 | $101,700 | $21,100 | $80,600 |
| 2021 | $3,184 | $91,400 | $13,550 | $77,850 |
| 2020 | $3,046 | $88,850 | $13,550 | $75,300 |
| 2019 | $2,853 | $86,350 | $13,550 | $72,800 |
| 2018 | $2,754 | $86,350 | $13,550 | $72,800 |
| 2017 | $2,750 | $88,050 | $13,550 | $74,500 |
| 2016 | $2,473 | $85,200 | $13,550 | $71,650 |
| 2015 | $2,472 | $78,000 | $9,550 | $68,450 |
| 2014 | $2,438 | $72,900 | $9,550 | $63,350 |
| 2013 | $2,339 | $72,900 | $9,550 | $63,350 |
Source: Public Records
Map
Nearby Homes