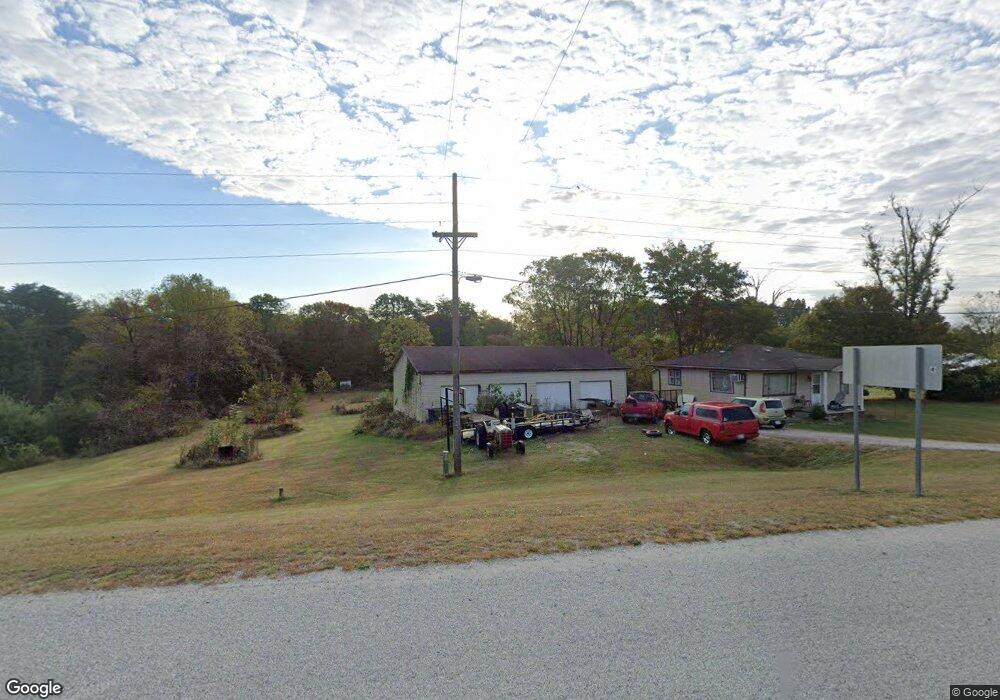
778 N State Road 3 Lexington, IN 47138
Estimated Value: $144,000 - $215,000
3
Beds
1
Bath
952
Sq Ft
$185/Sq Ft
Est. Value
About This Home
This home is located at 778 N State Road 3, Lexington, IN 47138 and is currently estimated at $175,755, approximately $184 per square foot. 778 N State Road 3 is a home located in Scott County with nearby schools including Scottsburg Senior High School.
Ownership History
Date
Name
Owned For
Owner Type
Purchase Details
Closed on
May 8, 2014
Sold by
Hopper Bernard W and Hopper Rettie M
Bought by
Hopper George Riley
Current Estimated Value
Create a Home Valuation Report for This Property
The Home Valuation Report is an in-depth analysis detailing your home's value as well as a comparison with similar homes in the area
Home Values in the Area
Average Home Value in this Area
Purchase History
| Date | Buyer | Sale Price | Title Company |
|---|---|---|---|
| Hopper George Riley | -- | None Available |
Source: Public Records
Tax History Compared to Growth
Tax History
| Year | Tax Paid | Tax Assessment Tax Assessment Total Assessment is a certain percentage of the fair market value that is determined by local assessors to be the total taxable value of land and additions on the property. | Land | Improvement |
|---|---|---|---|---|
| 2024 | $585 | $91,100 | $29,300 | $61,800 |
| 2023 | $572 | $90,600 | $29,300 | $61,300 |
| 2022 | $601 | $91,200 | $29,300 | $61,900 |
| 2021 | $618 | $91,200 | $27,700 | $63,500 |
| 2020 | $562 | $87,300 | $26,100 | $61,200 |
| 2019 | $552 | $86,300 | $26,100 | $60,200 |
| 2018 | $520 | $81,200 | $21,700 | $59,500 |
| 2017 | $512 | $81,800 | $22,600 | $59,200 |
| 2016 | $493 | $76,100 | $23,000 | $53,100 |
| 2014 | $444 | $72,200 | $23,300 | $48,900 |
| 2013 | $444 | $71,100 | $22,200 | $48,900 |
Source: Public Records
Map
Nearby Homes
- 1514 Skyline Dr
- 6429 E Blocher Rd
- 5462 E Mockingbird Ln
- 0 E Blocher Rd
- 6981 E Webster Rd
- 5628 E Polk Rd
- 1696 N Shea Rd
- 1521 N Spindlebrook Ln
- 11843 Indiana 56
- TBD Kent Indiana 256
- 0 Kent Indiana 256
- 4267 Kent Indiana 256
- 969 S Goshen Rd
- 1020 S Goshen Rd
- 1869 S Getty Rd
- 2621 S Alexander St
- 2789 N Bethlehem Rd
- 3518 S Robbins Rd
- 10105 Indiana 56
- 3528 S Robbins Rd
- 740 N State Road 3
- 1 E Bethel Rd
- 829 N State Road 3
- 852 N State Road 3
- 6393 E Bethel Rd
- 6389 E Bethel Rd
- 0 E State Road 56
- 907 N State Road 3
- 888 Indiana 3
- 939 N State Road 3
- 945 N State Road 3
- 0 E Bethel Rd Unit 201104559
- 0 E Bethel Rd Unit 201200645
- 0 E Bethel Rd Unit 201206053
- 0 E Bethel Rd Unit 201301558
- 0 E Bethel Rd Unit 201307777
- 0 E Bethel Rd Unit 201403926
- 0 N State Road 3
- 969 N State Road 3
- 987 N State Road 3