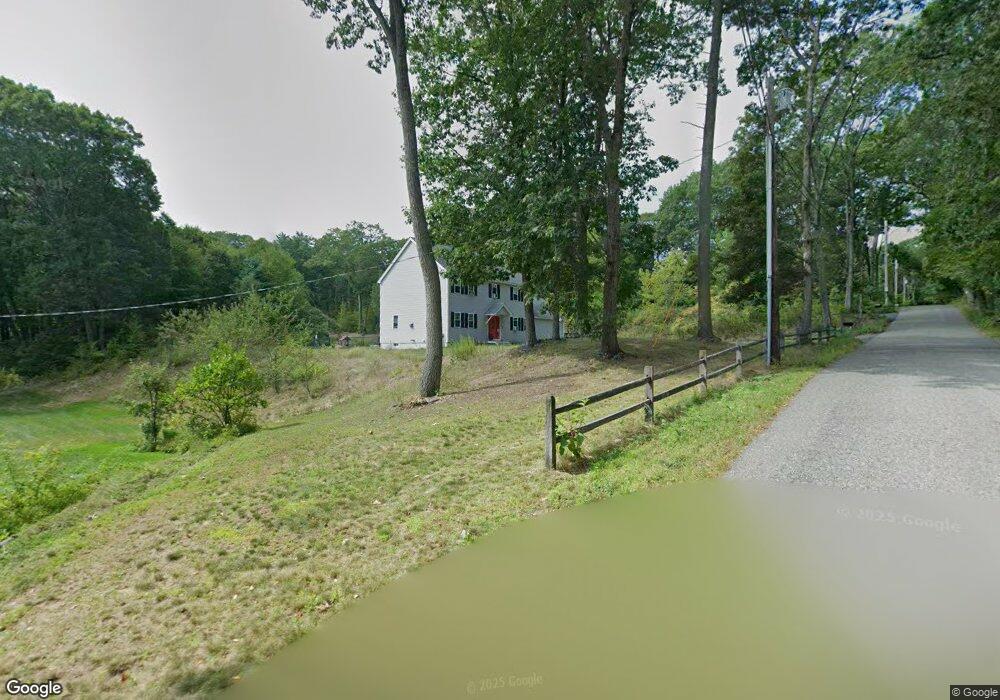
778 Page St Unit 2 Lunenburg, MA 01462
Estimated Value: $652,000 - $695,000
4
Beds
3
Baths
2,128
Sq Ft
$317/Sq Ft
Est. Value
About This Home
This home is located at 778 Page St Unit 2, Lunenburg, MA 01462 and is currently estimated at $673,918, approximately $316 per square foot. 778 Page St Unit 2 is a home located in Worcester County with nearby schools including Lunenburg Primary School and Lunenburg High School.
Ownership History
Date
Name
Owned For
Owner Type
Purchase Details
Closed on
Oct 14, 2022
Sold by
Kimball Everett H and Kimball Kerry A
Bought by
Kimball Kerry A
Current Estimated Value
Home Financials for this Owner
Home Financials are based on the most recent Mortgage that was taken out on this home.
Original Mortgage
$303,000
Outstanding Balance
$291,535
Interest Rate
6.02%
Mortgage Type
Stand Alone Refi Refinance Of Original Loan
Estimated Equity
$382,383
Purchase Details
Closed on
Oct 1, 2013
Sold by
1894 Partners Rt
Bought by
Kimball Everett H and Kimball Kerry A
Home Financials for this Owner
Home Financials are based on the most recent Mortgage that was taken out on this home.
Original Mortgage
$249,433
Interest Rate
4.42%
Mortgage Type
New Conventional
Create a Home Valuation Report for This Property
The Home Valuation Report is an in-depth analysis detailing your home's value as well as a comparison with similar homes in the area
Home Values in the Area
Average Home Value in this Area
Purchase History
| Date | Buyer | Sale Price | Title Company |
|---|---|---|---|
| Kimball Kerry A | -- | None Available | |
| Kimball Kerry A | -- | None Available | |
| Kimball Everett H | $329,433 | -- | |
| Kimball Everett H | $329,433 | -- |
Source: Public Records
Mortgage History
| Date | Status | Borrower | Loan Amount |
|---|---|---|---|
| Open | Kimball Kerry A | $303,000 | |
| Closed | Kimball Kerry A | $303,000 | |
| Previous Owner | Kimball Everett H | $249,433 |
Source: Public Records
Tax History Compared to Growth
Tax History
| Year | Tax Paid | Tax Assessment Tax Assessment Total Assessment is a certain percentage of the fair market value that is determined by local assessors to be the total taxable value of land and additions on the property. | Land | Improvement |
|---|---|---|---|---|
| 2025 | $7,968 | $554,900 | $140,100 | $414,800 |
| 2024 | $7,397 | $524,600 | $132,100 | $392,500 |
| 2023 | $7,123 | $487,200 | $120,100 | $367,100 |
| 2022 | $6,869 | $399,600 | $100,100 | $299,500 |
| 2020 | $6,759 | $373,000 | $100,100 | $272,900 |
| 2019 | $6,480 | $346,900 | $94,300 | $252,600 |
| 2018 | $6,550 | $332,500 | $94,300 | $238,200 |
| 2017 | $6,382 | $319,400 | $90,100 | $229,300 |
| 2016 | $6,030 | $307,500 | $85,700 | $221,800 |
| 2015 | $5,443 | $297,100 | $81,300 | $215,800 |
Source: Public Records
Map
Nearby Homes
- 11 Longwood Dr
- 166 Elmwood Rd
- 878 Flat Hill Rd
- 110 Burrage St
- 61 Parker Rd
- 49 Parker Rd
- 1790 Massachusetts Ave Unit 25
- 1790 Massachusetts Ave Unit 22
- 45 Spring St
- 330 Arbor St
- 12 Hazen Rd
- 2 Oakes Landing
- 659 Reservoir Rd
- 43 Longley Rd
- 4 Hill Ln
- 802 Reservoir Rd
- 4 Ambrose Way Unit 4
- 7 Ambrose Way Unit 5
- 6 Ambrose Way Unit 3
- 17 Ambrose Way Unit 17