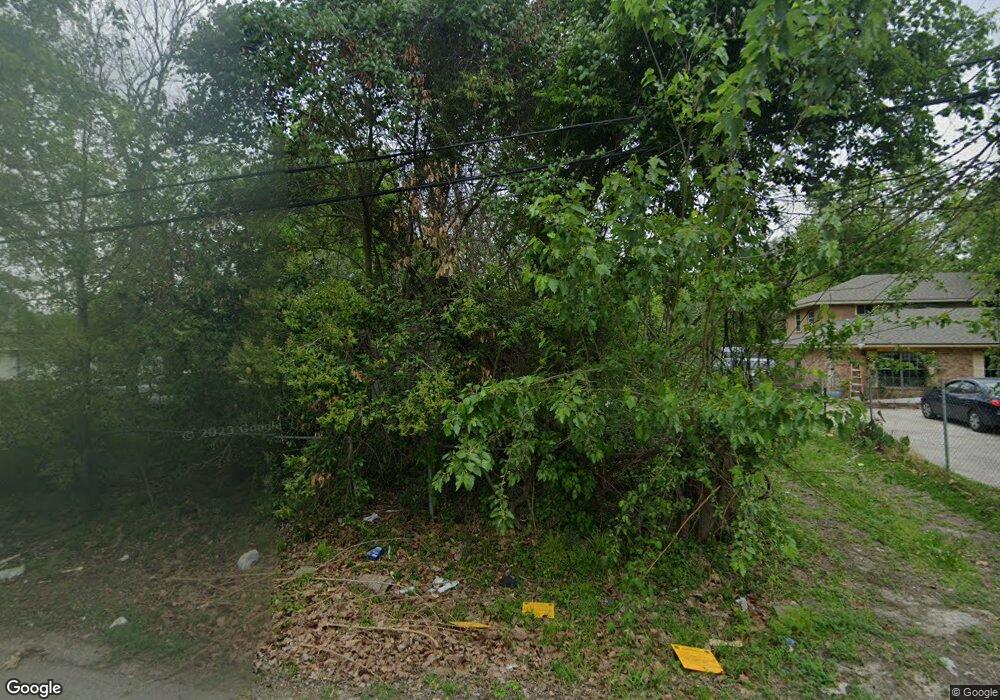
778 Rosie St Houston, TX 77091
Acres Homes NeighborhoodEstimated Value: $161,000 - $174,000
2
Beds
1
Bath
683
Sq Ft
$246/Sq Ft
Est. Value
About This Home
This home is located at 778 Rosie St, Houston, TX 77091 and is currently estimated at $167,992, approximately $245 per square foot. 778 Rosie St is a home located in Harris County with nearby schools including Wesley Elementary School, Williams Middle, and Booker T Washington Sr High.
Ownership History
Date
Name
Owned For
Owner Type
Purchase Details
Closed on
Dec 7, 2018
Sold by
Busby Robert
Bought by
Williams Evan
Current Estimated Value
Purchase Details
Closed on
Apr 17, 2015
Sold by
Rhem Willie
Bought by
Culton Ramell
Purchase Details
Closed on
May 20, 2009
Sold by
Norton Jack
Bought by
Rhem Willie
Purchase Details
Closed on
Apr 5, 2007
Sold by
Blackwood Edd C
Bought by
Norton Jack
Purchase Details
Closed on
May 21, 2003
Sold by
Blackwood Edd C
Bought by
Rhem Willie
Create a Home Valuation Report for This Property
The Home Valuation Report is an in-depth analysis detailing your home's value as well as a comparison with similar homes in the area
Home Values in the Area
Average Home Value in this Area
Purchase History
| Date | Buyer | Sale Price | Title Company |
|---|---|---|---|
| Williams Evan | $500 | None Available | |
| Culton Ramell | -- | None Available | |
| Rhem Willie | -- | None Available | |
| Norton Jack | -- | None Available | |
| Rhem Willie | -- | -- |
Source: Public Records
Tax History Compared to Growth
Tax History
| Year | Tax Paid | Tax Assessment Tax Assessment Total Assessment is a certain percentage of the fair market value that is determined by local assessors to be the total taxable value of land and additions on the property. | Land | Improvement |
|---|---|---|---|---|
| 2025 | $3,395 | $205,865 | $186,296 | $19,569 |
| 2024 | $3,395 | $162,264 | $142,695 | $19,569 |
| 2023 | $3,399 | $168,715 | $142,695 | $26,020 |
| 2022 | $3,231 | $146,740 | $126,840 | $19,900 |
| 2021 | $2,377 | $102,001 | $83,239 | $18,762 |
| 2020 | $1,963 | $81,044 | $63,420 | $17,624 |
| 2019 | $1,538 | $60,782 | $44,394 | $16,388 |
| 2018 | $1,453 | $57,435 | $44,394 | $13,041 |
| 2017 | $1,095 | $43,322 | $30,539 | $12,783 |
| 2016 | $1,095 | $43,322 | $30,539 | $12,783 |
| 2015 | $33 | $41,119 | $30,539 | $10,580 |
| 2014 | $33 | $41,119 | $30,539 | $10,580 |
Source: Public Records
Map
Nearby Homes
- 833 Rosie St
- 778 Pickering St
- 0 De Priest St Unit 66567963
- 0 Lovers Ln Unit 36585920
- 0 Rosie St
- 6610 Morrow St
- 843 Lovers Ln
- 6502 W Montgomery Rd
- 6738 W Montgomery Rd
- 6315 N Shepherd Dr
- 6343 W Montgomery Rd
- 6341 W Montgomery Rd
- 741 Granville Dr
- 6220 De Priest St
- 862 Granville Dr
- 6507 Radcliffe St
- 00 Radcliffe St
- 872 Lovers Ln
- 0 Radcliffe St
- 814 Granville Dr
- 780 Rosie St
- 776 Rosie St
- 774 Rosie St
- 786 Rosie St
- 779 Rosie St
- 771 Rosie St
- 6440 De Priest St
- 756 Rosie St
- 6506 De Priest St
- 6510 De Priest St
- 700 Rosie St
- 761 Rosie St
- 757 Rosie St
- 6514 De Priest St
- 6514 De Priest St
- 6514 De Priest St Unit B
- 6514 De Priest St Unit A
- 6516 De Priest St
- 6516 De Priest St Unit A & B
- 6516 De Priest St Unit 4