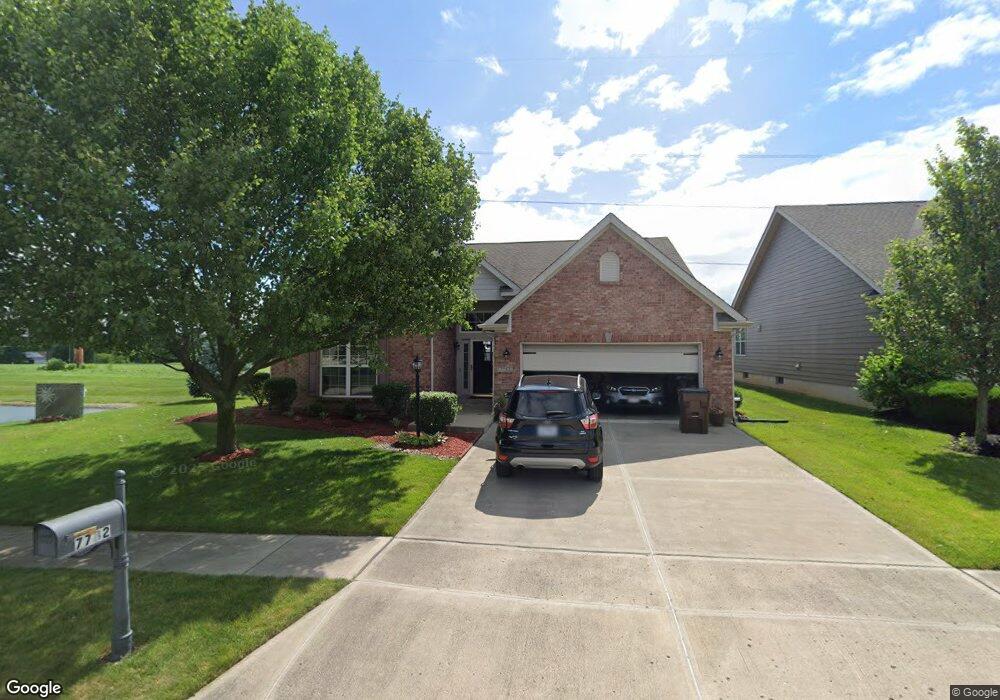
7782 Cilantro Way Clayton, OH 45315
Estimated Value: $355,869 - $388,000
3
Beds
2
Baths
2,115
Sq Ft
$177/Sq Ft
Est. Value
About This Home
This home is located at 7782 Cilantro Way, Clayton, OH 45315 and is currently estimated at $374,967, approximately $177 per square foot. 7782 Cilantro Way is a home located in Montgomery County with nearby schools including Northmoor Elementary School and Salem Christian Academy.
Ownership History
Date
Name
Owned For
Owner Type
Purchase Details
Closed on
Oct 15, 2024
Sold by
Snedeker James B and Snedeker Deanna D
Bought by
Gregory Mary F
Current Estimated Value
Purchase Details
Closed on
May 6, 2016
Sold by
Magee Mollie S and Magee Mark A
Bought by
Snedeker James B and Snedeker Deanna D
Home Financials for this Owner
Home Financials are based on the most recent Mortgage that was taken out on this home.
Original Mortgage
$125,000
Interest Rate
3.71%
Mortgage Type
New Conventional
Purchase Details
Closed on
Jul 30, 2015
Sold by
Denlinger & Sons Builders Inc
Bought by
Magee Mark A and Magee Mollie S
Home Financials for this Owner
Home Financials are based on the most recent Mortgage that was taken out on this home.
Original Mortgage
$155,000
Interest Rate
3.12%
Mortgage Type
Construction
Purchase Details
Closed on
Apr 30, 2008
Sold by
Inverness Group Inc
Bought by
Magee Mollie S and Magee Mark A
Create a Home Valuation Report for This Property
The Home Valuation Report is an in-depth analysis detailing your home's value as well as a comparison with similar homes in the area
Home Values in the Area
Average Home Value in this Area
Purchase History
| Date | Buyer | Sale Price | Title Company |
|---|---|---|---|
| Gregory Mary F | $340,000 | Landmark Title | |
| Snedeker James B | $200,000 | Landmark Title Agency South | |
| Magee Mark A | $30,000 | Attorney | |
| Magee Mollie S | $251,400 | None Available |
Source: Public Records
Mortgage History
| Date | Status | Borrower | Loan Amount |
|---|---|---|---|
| Previous Owner | Snedeker James B | $125,000 | |
| Previous Owner | Magee Mark A | $155,000 |
Source: Public Records
Tax History Compared to Growth
Tax History
| Year | Tax Paid | Tax Assessment Tax Assessment Total Assessment is a certain percentage of the fair market value that is determined by local assessors to be the total taxable value of land and additions on the property. | Land | Improvement |
|---|---|---|---|---|
| 2024 | $5,373 | $90,510 | $16,940 | $73,570 |
| 2023 | $5,373 | $90,510 | $16,940 | $73,570 |
| 2022 | $5,663 | $74,810 | $14,000 | $60,810 |
| 2021 | $5,802 | $74,810 | $14,000 | $60,810 |
| 2020 | $5,795 | $74,810 | $14,000 | $60,810 |
| 2019 | $5,721 | $66,470 | $15,400 | $51,070 |
| 2018 | $5,736 | $66,470 | $15,400 | $51,070 |
| 2017 | $5,677 | $66,470 | $15,400 | $51,070 |
| 2016 | $5,214 | $59,570 | $14,000 | $45,570 |
| 2015 | $4,802 | $59,570 | $14,000 | $45,570 |
| 2014 | $4,802 | $59,570 | $14,000 | $45,570 |
| 2012 | -- | $68,350 | $18,550 | $49,800 |
Source: Public Records
Map
Nearby Homes
- 7746 Cilantro Way
- 7739 Cilantro Way
- 7706 Cilantro Way
- 7754 Cilantro Way
- 7750 Cilantro Way
- 5769 Dill Blvd
- Chatham Plan at Wenger Village
- Milford Plan at Wenger Village
- Holcombe Plan at Wenger Village
- Newcastle Plan at Wenger Village
- Pendleton Plan at Wenger Village
- Bellamy Plan at Wenger Village
- Henley Plan at Wenger Village
- 7980 Parsley Place
- 508 Korner Ave
- 7776 Crestway Rd
- 7710 Crestway Dr
- 558 Clinton St
- 0 Meiring St Unit 866058
- 4784 Molunat
- 7776 Cilantro Way
- 7770 Cilantro Way
- 0 Cilantro Way
- 7764 Cilantro Way
- 7783 Cilantro Way
- 7777 Cilantro Way Unit Lot12
- 7777 Cilantro Way
- 7771 Cilantro Way Lot #11
- 7771 Cilantro Way
- 7789 Cilantro Way
- 7765 Cilantro Way
- 7758 Cilantro Way Lot #8
- 7758 Cilantro Way
- 7714 Cilantro Way
- 7759 Cilantro Way Unit 9 Lot
- 7759 Cilantro Way
- 5758 Dill Blvd
- 7864 Marjoram Place
- 7858 Marjoram Place Unit Lot17
- 7858 Marjoram Place