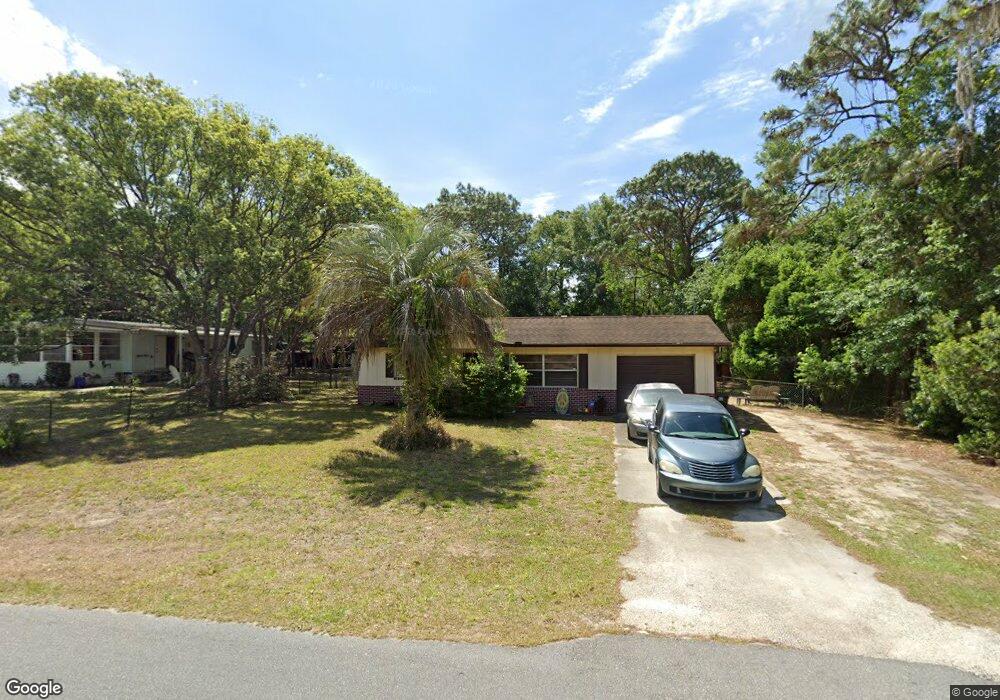
7784 W Solar Place Homosassa, FL 34448
Estimated Value: $148,550 - $179,000
2
Beds
1
Bath
884
Sq Ft
$182/Sq Ft
Est. Value
About This Home
This home is located at 7784 W Solar Place, Homosassa, FL 34448 and is currently estimated at $160,638, approximately $181 per square foot. 7784 W Solar Place is a home located in Citrus County with nearby schools including Homosassa Elementary School, Crystal River High School, and Crystal River Middle School.
Ownership History
Date
Name
Owned For
Owner Type
Purchase Details
Closed on
Oct 13, 2006
Sold by
Cox William P and Phillips Diane L
Bought by
Cox William P and Phillips Diane L
Current Estimated Value
Purchase Details
Closed on
Oct 1, 2006
Bought by
Phillips Diane L and Conrad Deborah E
Purchase Details
Closed on
Dec 14, 2005
Sold by
Phillips Diane L and Conrod Deborah E
Bought by
Cox William P
Purchase Details
Closed on
Dec 1, 2005
Bought by
Phillips Diane L and Conrad Deborah E
Purchase Details
Closed on
May 1, 1997
Bought by
Phillips Diane L and Conrad Deborah E
Purchase Details
Closed on
Jan 1, 1994
Bought by
Phillips Diane L and Conrad Deborah E
Purchase Details
Closed on
Dec 1, 1983
Bought by
Phillips Diane L and Conrad Deborah E
Purchase Details
Closed on
May 1, 1980
Bought by
Phillips Diane L and Conrad Deborah E
Purchase Details
Closed on
Feb 1, 1978
Bought by
Phillips Diane L and Conrad Deborah E
Create a Home Valuation Report for This Property
The Home Valuation Report is an in-depth analysis detailing your home's value as well as a comparison with similar homes in the area
Home Values in the Area
Average Home Value in this Area
Purchase History
| Date | Buyer | Sale Price | Title Company |
|---|---|---|---|
| Cox William P | -- | None Available | |
| Phillips Diane L | $100 | -- | |
| Cox William P | -- | Land Title Insurance Of Citr | |
| Phillips Diane L | $100 | -- | |
| Phillips Diane L | $100 | -- | |
| Phillips Diane L | $45,000 | -- | |
| Phillips Diane L | $100 | -- | |
| Phillips Diane L | $29,900 | -- | |
| Phillips Diane L | $22,500 | -- |
Source: Public Records
Tax History Compared to Growth
Tax History
| Year | Tax Paid | Tax Assessment Tax Assessment Total Assessment is a certain percentage of the fair market value that is determined by local assessors to be the total taxable value of land and additions on the property. | Land | Improvement |
|---|---|---|---|---|
| 2024 | $1,220 | $104,985 | $12,000 | $92,985 |
| 2023 | $1,220 | $53,544 | $0 | $0 |
| 2022 | $1,024 | $77,051 | $3,450 | $73,601 |
| 2021 | $879 | $58,580 | $3,400 | $55,180 |
| 2020 | $760 | $52,306 | $3,400 | $48,906 |
| 2019 | $686 | $43,595 | $3,400 | $40,195 |
| 2018 | $614 | $38,616 | $3,400 | $35,216 |
| 2017 | $565 | $33,292 | $3,400 | $29,892 |
| 2016 | $520 | $27,476 | $3,400 | $24,076 |
| 2015 | $487 | $25,074 | $3,400 | $21,674 |
| 2014 | $543 | $27,550 | $3,638 | $23,912 |
Source: Public Records
Map
Nearby Homes
- 7798 W Solar Place
- 7832 W Solar Place
- 7843 W Solar Place
- 7937 W Solar Place
- 7637 W Sunburst Ln
- 7947 W Luxemburg Ln
- 7870 W Ox Eye Place
- 7941 W Ox Eye Place
- 8048 W Fern Place
- 7898 W Fern Place
- 3193 S Kings Ave
- 3183 S Kings Ave
- 4125 S Grandmarch Ave
- 3740 S Eastpark Way
- 8145 W Fern Place
- 7810 W Fern Place
- 3423 S Alabama Ave
- 7860 W Homosassa Trail
- 7799 W Fern Place
- 8090 & 8112 W Mistflower Place
- 7781 W Solar Place
- 7791 W Solar Place Unit 1P
- 7791 W Solar Place
- 7789 W Solar Place
- 7789 W Solar Place Unit 1P
- 7655 W Candlewick Ln
- 7803 W Solar Place
- 7803 & 7805 W Solar Place
- 7805 W Solar Place
- 7668 W Sunburst Ln
- 7753 W Solar Place
- 7754 W Solar Place
- 7843&7845 Solar Place
- 7843 & 7845 W Solar Place
- 7775 W Solar Place
- 3701 S Missouri Dr
- 7740 W Rosedale Dr
- 3747 S Missouri Dr
- 7645 W Candlewick Ln
- 7749 W Solar Place