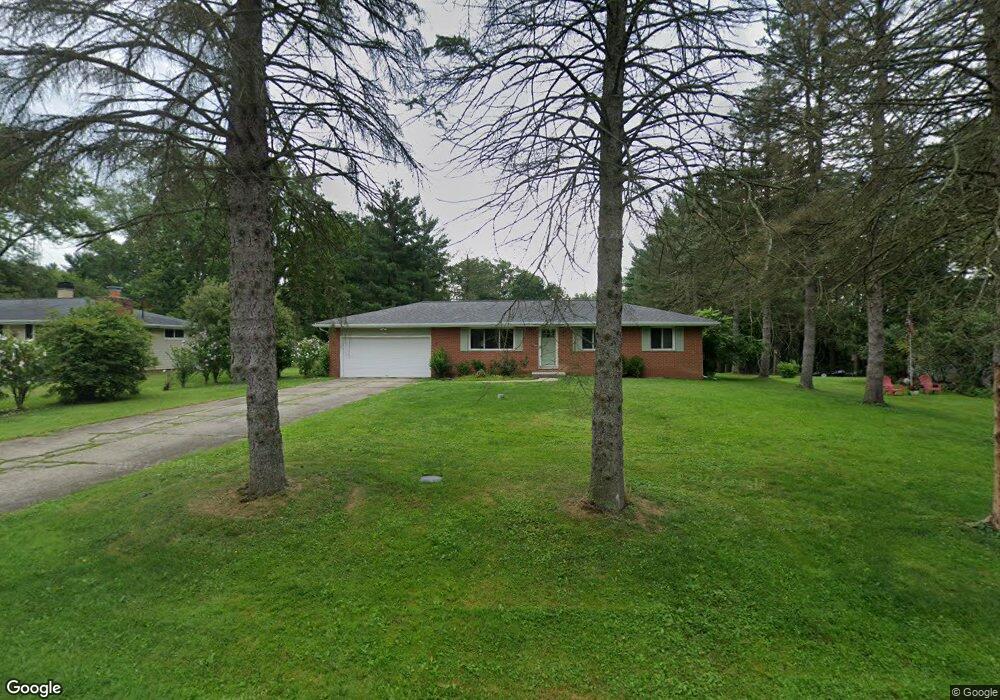
7789 Glenn Allen Dr Northfield, OH 44067
Estimated Value: $265,552 - $317,000
3
Beds
2
Baths
1,092
Sq Ft
$257/Sq Ft
Est. Value
About This Home
This home is located at 7789 Glenn Allen Dr, Northfield, OH 44067 and is currently estimated at $281,138, approximately $257 per square foot. 7789 Glenn Allen Dr is a home located in Summit County with nearby schools including Lee Eaton Elementary School, Nordonia Middle School, and Nordonia High School.
Ownership History
Date
Name
Owned For
Owner Type
Purchase Details
Closed on
Feb 13, 2018
Sold by
Leverentz Eileen P
Bought by
Bissell Donald
Current Estimated Value
Home Financials for this Owner
Home Financials are based on the most recent Mortgage that was taken out on this home.
Original Mortgage
$172,633
Interest Rate
4.04%
Mortgage Type
VA
Purchase Details
Closed on
Sep 20, 2017
Sold by
Leverentz Eileen and Leverentz James Robert
Bought by
Leverentz Eileen
Purchase Details
Closed on
Aug 4, 2006
Sold by
Roethel Edwin J
Bought by
Leverentz James R and Leverentz Eileen P
Home Financials for this Owner
Home Financials are based on the most recent Mortgage that was taken out on this home.
Original Mortgage
$147,000
Interest Rate
6.82%
Mortgage Type
Purchase Money Mortgage
Create a Home Valuation Report for This Property
The Home Valuation Report is an in-depth analysis detailing your home's value as well as a comparison with similar homes in the area
Home Values in the Area
Average Home Value in this Area
Purchase History
| Date | Buyer | Sale Price | Title Company |
|---|---|---|---|
| Bissell Donald | $169,000 | Consumer Direct Title | |
| Leverentz Eileen | -- | None Available | |
| Leverentz James R | $187,000 | Progressive Land Title |
Source: Public Records
Mortgage History
| Date | Status | Borrower | Loan Amount |
|---|---|---|---|
| Previous Owner | Bissell Donald | $172,633 | |
| Previous Owner | Leverentz James R | $147,000 |
Source: Public Records
Tax History Compared to Growth
Tax History
| Year | Tax Paid | Tax Assessment Tax Assessment Total Assessment is a certain percentage of the fair market value that is determined by local assessors to be the total taxable value of land and additions on the property. | Land | Improvement |
|---|---|---|---|---|
| 2025 | $3,974 | $79,916 | $18,519 | $61,397 |
| 2024 | $3,974 | $79,916 | $18,519 | $61,397 |
| 2023 | $3,974 | $79,916 | $18,519 | $61,397 |
| 2022 | $3,771 | $61,474 | $14,245 | $47,229 |
| 2021 | $3,694 | $61,474 | $14,245 | $47,229 |
| 2020 | $3,632 | $61,480 | $14,250 | $47,230 |
| 2019 | $2,988 | $45,470 | $12,820 | $32,650 |
| 2018 | $2,626 | $45,470 | $12,820 | $32,650 |
| 2017 | $2,462 | $45,470 | $12,820 | $32,650 |
| 2016 | $2,462 | $41,380 | $12,820 | $28,560 |
| 2015 | $2,462 | $41,380 | $12,820 | $28,560 |
| 2014 | $2,446 | $41,380 | $12,820 | $28,560 |
| 2013 | $3,129 | $53,370 | $12,820 | $40,550 |
Source: Public Records
Map
Nearby Homes
- 8134 N Boyden Rd
- 190 Springwood Rd
- 628 Windsor Ln
- 9434 Olde 8 Rd
- S/L Carlin Dr
- 7484 Millrace Ln
- 7571 Silverleaf Ct
- 804 Arboretum Cir Unit 804
- 395 Spring Pond Rd
- 648 Rehwinkle Rd
- 845 Arboretum Cir
- 842 Arboretum Cir
- 688 Greenwood Ct
- 966 Nesbitt Rd
- 188 Timberlane Dr
- 171 Butternut Ln
- 8510 Waterside Dr
- 874 Hemlock Ln
- 7840 Carter Rd
- 6320 Greenwood Pkwy Unit 100-4
- 7779 Glenn Allen Dr
- 7799 Glenn Allen Dr
- 7809 Glenn Allen Dr
- 375 Lynnview Dr
- 7819 Glenn Allen Dr
- 7888 N Boyden Rd
- 390 Lynnview Dr
- 7930 N Boyden Rd
- 7944 N Boyden Rd
- 7831 Glenn Allen Dr
- 7916 N Boyden Rd
- 402 Lynnview Dr
- 385 Lynnview Dr
- 7814 Glenn Allen Dr
- 7954 N Boyden Rd
- 7904 N Boyden Rd
- 7824 Glenn Allen Dr
- 7841 Glenn Allen Dr
- 412 Lynnview Dr
- 419 Lynnview Dr