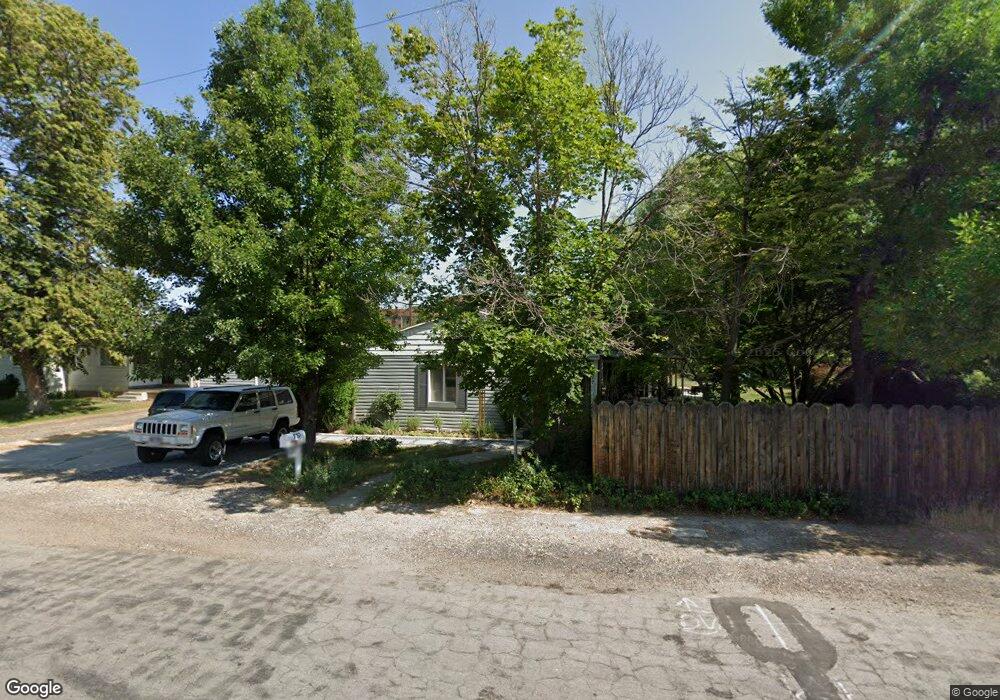
779 E 4125 S Salt Lake City, UT 84107
Estimated Value: $605,000 - $677,000
3
Beds
3
Baths
2,164
Sq Ft
$296/Sq Ft
Est. Value
About This Home
This home is located at 779 E 4125 S, Salt Lake City, UT 84107 and is currently estimated at $640,140, approximately $295 per square foot. 779 E 4125 S is a home located in Salt Lake County with nearby schools including James E Moss Elementary School, Twin Peaks Elementary School, and Bonneville Junior High School.
Ownership History
Date
Name
Owned For
Owner Type
Purchase Details
Closed on
Aug 8, 2006
Sold by
Johnson Kathleen
Bought by
Johnson Kathleen
Current Estimated Value
Home Financials for this Owner
Home Financials are based on the most recent Mortgage that was taken out on this home.
Original Mortgage
$139,000
Outstanding Balance
$83,453
Interest Rate
6.76%
Mortgage Type
Stand Alone Refi Refinance Of Original Loan
Estimated Equity
$556,687
Purchase Details
Closed on
May 15, 1998
Sold by
Johnson Shannon B
Bought by
Johnson Kathleen
Create a Home Valuation Report for This Property
The Home Valuation Report is an in-depth analysis detailing your home's value as well as a comparison with similar homes in the area
Home Values in the Area
Average Home Value in this Area
Purchase History
| Date | Buyer | Sale Price | Title Company |
|---|---|---|---|
| Johnson Kathleen | -- | Atlas Title Murray | |
| Johnson Kathleen | -- | -- |
Source: Public Records
Mortgage History
| Date | Status | Borrower | Loan Amount |
|---|---|---|---|
| Open | Johnson Kathleen | $139,000 |
Source: Public Records
Tax History Compared to Growth
Tax History
| Year | Tax Paid | Tax Assessment Tax Assessment Total Assessment is a certain percentage of the fair market value that is determined by local assessors to be the total taxable value of land and additions on the property. | Land | Improvement |
|---|---|---|---|---|
| 2025 | $3,315 | $559,900 | $294,200 | $265,700 |
| 2024 | $3,315 | $516,100 | $285,000 | $231,100 |
| 2023 | $3,315 | $492,600 | $288,400 | $204,200 |
| 2022 | $2,888 | $436,700 | $271,800 | $164,900 |
| 2021 | $2,736 | $358,700 | $209,100 | $149,600 |
| 2020 | $2,705 | $335,300 | $203,300 | $132,000 |
| 2019 | $2,734 | $330,900 | $193,200 | $137,700 |
| 2018 | $2,527 | $294,400 | $193,200 | $101,200 |
| 2017 | $2,254 | $274,800 | $193,200 | $81,600 |
| 2016 | $2,009 | $247,800 | $193,200 | $54,600 |
| 2015 | $2,158 | $249,000 | $201,000 | $48,000 |
| 2014 | $2,044 | $230,900 | $197,100 | $33,800 |
Source: Public Records
Map
Nearby Homes
- 779 E 4070 S
- 832 E 4170 S
- 834 E 4170 S
- 689 E 4149 S
- 830 E 3990 S Unit D
- 4040 S 685 E Unit F
- 4040 S 685 E Unit F
- 4356 S 900 E
- 825 E 3990 S Unit C
- 657 E 4065 S Unit C
- 3965 S 805 E Unit B
- 651 E 4025 S Unit G
- 3970 S 840 E Unit A
- 4178 S 650 E
- 3938 S 805 E Unit A
- 3924 S 805 E Unit B
- 607 E 4030 S
- 787 E 4315 S
- 3944 S 900 E Unit 204
- 3944 S 900 E Unit 203