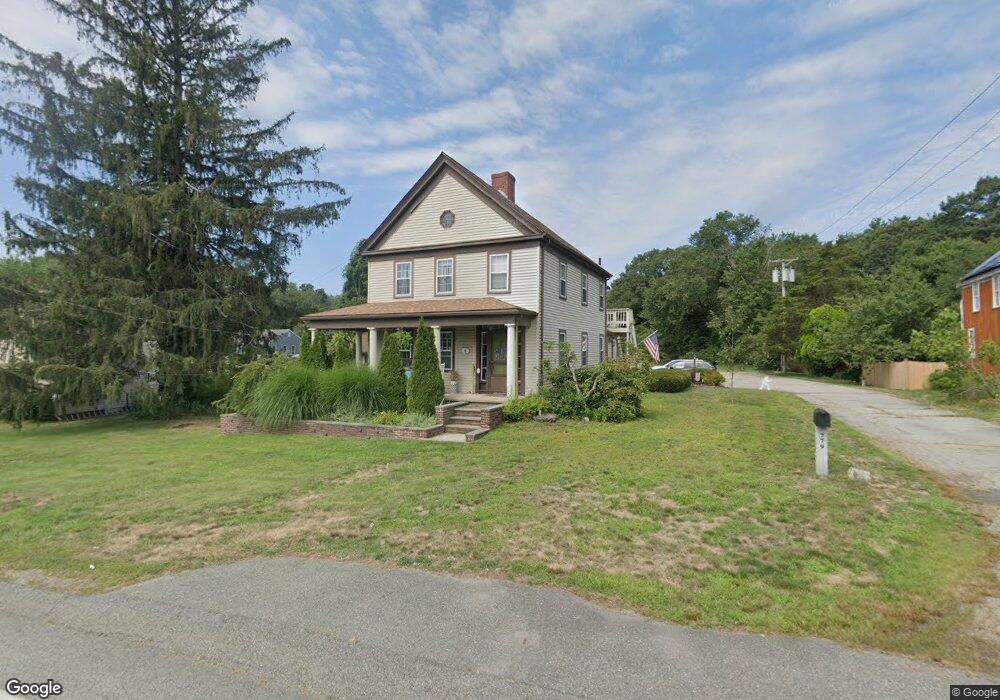
779 Front St Weymouth, MA 02188
South Weymouth NeighborhoodEstimated Value: $812,000 - $997,000
4
Beds
2
Baths
3,328
Sq Ft
$262/Sq Ft
Est. Value
About This Home
This home is located at 779 Front St, Weymouth, MA 02188 and is currently estimated at $872,929, approximately $262 per square foot. 779 Front St is a home located in Norfolk County with nearby schools including Thomas V Nash, Abigail Adams Middle School, and Weymouth Middle School Chapman.
Ownership History
Date
Name
Owned For
Owner Type
Purchase Details
Closed on
Feb 2, 1990
Sold by
Pelrine Laurence W
Bought by
Pelrine Thomas J
Current Estimated Value
Home Financials for this Owner
Home Financials are based on the most recent Mortgage that was taken out on this home.
Original Mortgage
$135,000
Interest Rate
9.59%
Mortgage Type
Purchase Money Mortgage
Create a Home Valuation Report for This Property
The Home Valuation Report is an in-depth analysis detailing your home's value as well as a comparison with similar homes in the area
Home Values in the Area
Average Home Value in this Area
Purchase History
| Date | Buyer | Sale Price | Title Company |
|---|---|---|---|
| Pelrine Thomas J | $225,000 | -- |
Source: Public Records
Mortgage History
| Date | Status | Borrower | Loan Amount |
|---|---|---|---|
| Open | Pelrine Thomas J | $171,600 | |
| Closed | Pelrine Thomas J | $135,000 |
Source: Public Records
Tax History Compared to Growth
Tax History
| Year | Tax Paid | Tax Assessment Tax Assessment Total Assessment is a certain percentage of the fair market value that is determined by local assessors to be the total taxable value of land and additions on the property. | Land | Improvement |
|---|---|---|---|---|
| 2025 | $7,553 | $747,800 | $225,000 | $522,800 |
| 2024 | $7,319 | $712,700 | $214,300 | $498,400 |
| 2023 | $7,125 | $681,800 | $198,500 | $483,300 |
| 2022 | $6,895 | $601,700 | $183,800 | $417,900 |
| 2021 | $7,002 | $596,400 | $183,800 | $412,600 |
| 2020 | $6,803 | $570,700 | $183,800 | $386,900 |
| 2019 | $6,633 | $547,300 | $176,700 | $370,600 |
| 2018 | $6,088 | $487,000 | $168,300 | $318,700 |
| 2017 | $5,545 | $432,900 | $160,300 | $272,600 |
| 2016 | $5,253 | $410,400 | $154,100 | $256,300 |
| 2015 | $5,057 | $392,000 | $154,100 | $237,900 |
| 2014 | $5,021 | $377,500 | $143,400 | $234,100 |
Source: Public Records
Map
Nearby Homes
- 200 Justin Dr Unit 3
- 116 Belmont St
- 2 Tara Dr Unit 1
- 255 West St
- 655 Summer St
- 262 West St
- 501 Commerce Dr Unit 2310
- 501 Commerce Dr Unit 1111
- 501 Commerce Dr Unit 4206
- 501 Commerce Dr Unit 4308
- 501 Commerce Dr Unit 4306
- 747 Middle St
- 2 Mitchell Ln Unit B
- 92 Mercury St
- 215 Winter St Unit 1P
- 54 Federal St
- 200 Burkhall St Unit 803
- 200 Burkhall St Unit 102
- 24 Blake Rd
- 48 Apple Tree Ln