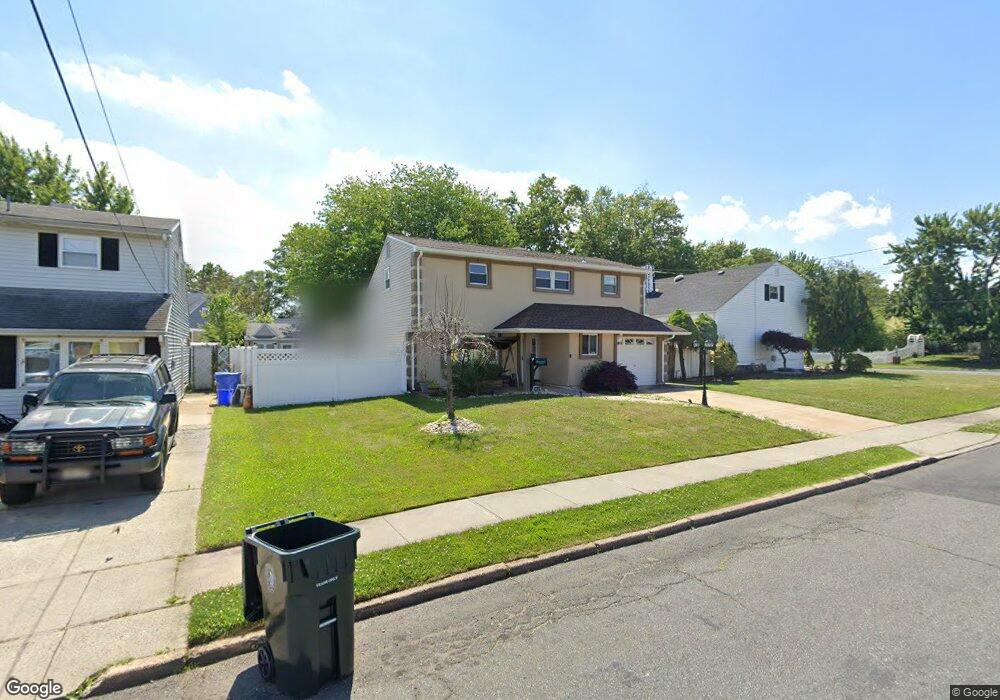
779 May Ave Perth Amboy, NJ 08861
Spa Springs NeighborhoodEstimated Value: $474,716
3
Beds
2
Baths
1,412
Sq Ft
$336/Sq Ft
Est. Value
About This Home
This home is located at 779 May Ave, Perth Amboy, NJ 08861 and is currently estimated at $474,716, approximately $336 per square foot. 779 May Ave is a home located in Middlesex County with nearby schools including Perth Amboy High School, Academy for Urban Leadership Charter School, and St James School-Woodbridge.
Ownership History
Date
Name
Owned For
Owner Type
Purchase Details
Closed on
Feb 12, 2015
Sold by
Diaz Pedro
Bought by
Minacapelli Ingrid
Current Estimated Value
Home Financials for this Owner
Home Financials are based on the most recent Mortgage that was taken out on this home.
Original Mortgage
$245,000
Outstanding Balance
$186,956
Interest Rate
3.66%
Mortgage Type
VA
Estimated Equity
$287,760
Purchase Details
Closed on
Dec 18, 2013
Sold by
Santiago Jannette and Santiago Efrain
Bought by
Diaz Pedro
Create a Home Valuation Report for This Property
The Home Valuation Report is an in-depth analysis detailing your home's value as well as a comparison with similar homes in the area
Home Values in the Area
Average Home Value in this Area
Purchase History
| Date | Buyer | Sale Price | Title Company |
|---|---|---|---|
| Minacapelli Ingrid | $245,000 | Multiple | |
| Diaz Pedro | $141,000 | None Available |
Source: Public Records
Mortgage History
| Date | Status | Borrower | Loan Amount |
|---|---|---|---|
| Open | Minacapelli Ingrid | $245,000 |
Source: Public Records
Tax History Compared to Growth
Tax History
| Year | Tax Paid | Tax Assessment Tax Assessment Total Assessment is a certain percentage of the fair market value that is determined by local assessors to be the total taxable value of land and additions on the property. | Land | Improvement |
|---|---|---|---|---|
| 2025 | -- | $243,300 | $138,800 | $104,500 |
| 2024 | -- | $243,300 | $138,800 | $104,500 |
| 2023 | -- | $243,300 | $138,800 | $104,500 |
| 2022 | $0 | $243,300 | $138,800 | $104,500 |
| 2021 | $0 | $243,300 | $138,800 | $104,500 |
| 2020 | $0 | $243,300 | $138,800 | $104,500 |
| 2019 | $0 | $243,300 | $138,800 | $104,500 |
| 2018 | $0 | $243,300 | $138,800 | $104,500 |
| 2017 | $0 | $243,300 | $138,800 | $104,500 |
| 2016 | $0 | $243,300 | $138,800 | $104,500 |
| 2015 | $7,056 | $243,300 | $138,800 | $104,500 |
| 2014 | $7,099 | $243,300 | $138,800 | $104,500 |
Source: Public Records
Map
Nearby Homes