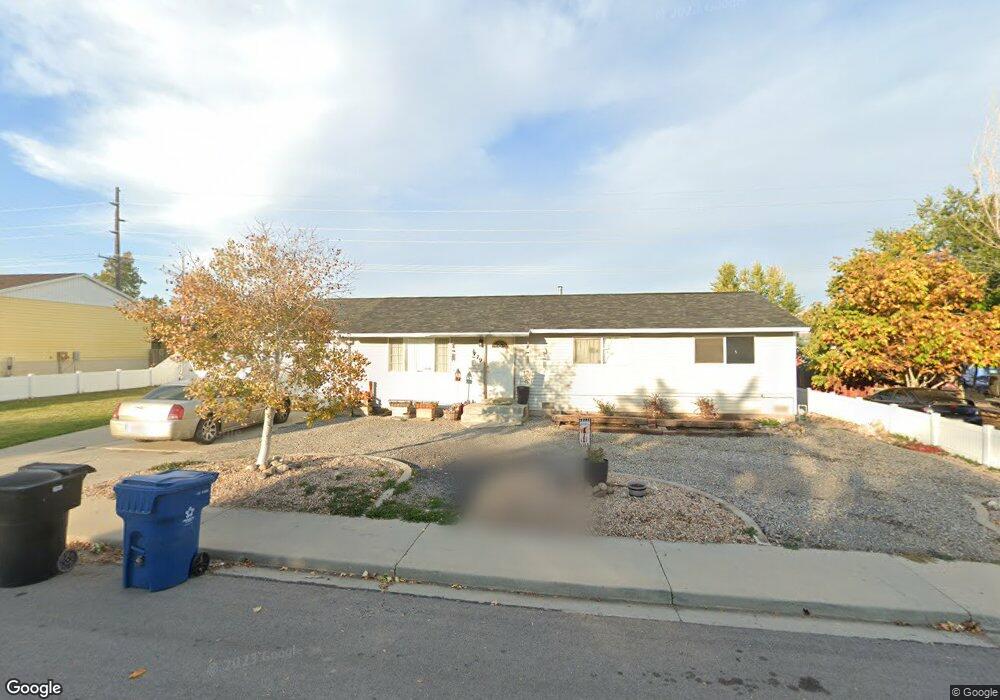
779 N 600 E Payson, UT 84651
Estimated Value: $383,000 - $427,000
3
Beds
1
Bath
1,196
Sq Ft
$334/Sq Ft
Est. Value
About This Home
This home is located at 779 N 600 E, Payson, UT 84651 and is currently estimated at $399,187, approximately $333 per square foot. 779 N 600 E is a home located in Utah County with nearby schools including Barnett Elementary School, Salem Junior High School, and Valley View Middle School.
Ownership History
Date
Name
Owned For
Owner Type
Purchase Details
Closed on
Mar 12, 2019
Sold by
Durrant Victoria
Bought by
Durrant Victoria and The Victoria Durrant Revocable
Current Estimated Value
Purchase Details
Closed on
Dec 6, 2004
Sold by
Durrant James J
Bought by
Durrant James
Home Financials for this Owner
Home Financials are based on the most recent Mortgage that was taken out on this home.
Original Mortgage
$96,800
Interest Rate
5.64%
Mortgage Type
New Conventional
Create a Home Valuation Report for This Property
The Home Valuation Report is an in-depth analysis detailing your home's value as well as a comparison with similar homes in the area
Home Values in the Area
Average Home Value in this Area
Purchase History
| Date | Buyer | Sale Price | Title Company |
|---|---|---|---|
| Durrant Victoria | -- | None Available | |
| Durrant Victoria | -- | None Available | |
| Durrant James | -- | Guardian Title Company Of U | |
| Durrant James J | -- | Guardian Title Company Of U |
Source: Public Records
Mortgage History
| Date | Status | Borrower | Loan Amount |
|---|---|---|---|
| Closed | Durrant James J | $96,800 | |
| Closed | Durrant James | $18,150 |
Source: Public Records
Tax History
| Year | Tax Paid | Tax Assessment Tax Assessment Total Assessment is a certain percentage of the fair market value that is determined by local assessors to be the total taxable value of land and additions on the property. | Land | Improvement |
|---|---|---|---|---|
| 2025 | $1,657 | $189,475 | -- | -- |
| 2024 | $1,657 | $168,630 | $0 | $0 |
| 2023 | $1,638 | $167,145 | $0 | $0 |
| 2022 | $1,666 | $167,200 | $0 | $0 |
| 2021 | $1,427 | $229,700 | $89,800 | $139,900 |
| 2020 | $1,350 | $212,600 | $81,600 | $131,000 |
| 2019 | $1,264 | $204,100 | $73,100 | $131,000 |
| 2018 | $1,151 | $179,200 | $65,300 | $113,900 |
| 2017 | $1,014 | $84,865 | $0 | $0 |
| 2016 | $884 | $73,480 | $0 | $0 |
| 2015 | $866 | $71,555 | $0 | $0 |
| 2014 | $777 | $64,625 | $0 | $0 |
Source: Public Records
Map
Nearby Homes
- 682 N 500 E
- 574 N 450 E
- 339 N 500 E Unit 3
- 327 N 500 E Unit 2
- 331 N 500 E Unit 2
- 446 N 460 E Unit 9
- 443 E 450 N
- 433 E 450 N
- 332 N 500 E
- 1289 N Bamberger Rd
- 603 900 N
- 873 E 200 N
- 420 N 150 W
- 1287 N 1390 E Unit 25-96
- 361 W 625 N Unit A-D
- 383 W 625 N Unit A-D
- 1058 E 100 N
- 118 E 100 N
- 228 E Utah Ave
- 1299 E 1670 N Unit 812
Your Personal Tour Guide
Ask me questions while you tour the home.