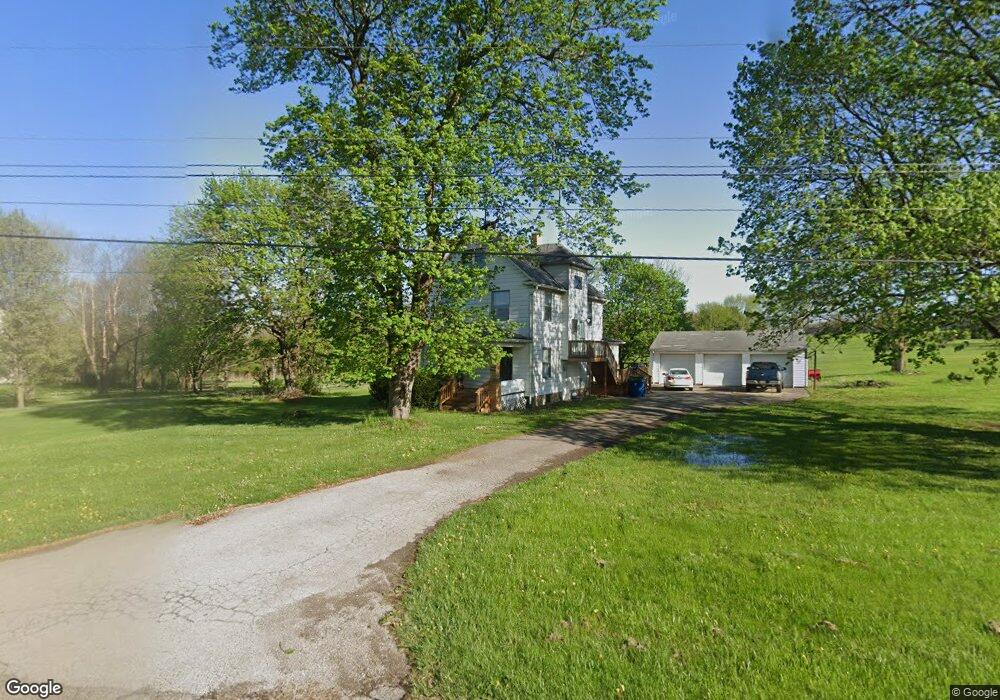
7793 E Liberty St Hubbard, OH 44425
Estimated Value: $150,590 - $213,000
4
Beds
2
Baths
1,616
Sq Ft
$116/Sq Ft
Est. Value
About This Home
This home is located at 7793 E Liberty St, Hubbard, OH 44425 and is currently estimated at $186,648, approximately $115 per square foot. 7793 E Liberty St is a home located in Trumbull County with nearby schools including Hubbard Elementary School, Hubbard Middle School, and Hubbard High School.
Ownership History
Date
Name
Owned For
Owner Type
Purchase Details
Closed on
May 2, 2024
Sold by
Piros Kaala
Bought by
Piros Brandon
Current Estimated Value
Home Financials for this Owner
Home Financials are based on the most recent Mortgage that was taken out on this home.
Original Mortgage
$40,000
Outstanding Balance
$39,429
Interest Rate
6.79%
Mortgage Type
Seller Take Back
Estimated Equity
$147,219
Purchase Details
Closed on
Nov 11, 2017
Sold by
Lacivita Lawrence A
Bought by
Piros Brandon and Piros Kaala D
Purchase Details
Closed on
Dec 27, 2016
Sold by
Lacivita Susan M and Mangan Christine M
Bought by
Lacivita Lawrence A
Purchase Details
Closed on
Oct 13, 2016
Sold by
Lacivita James A
Bought by
Lacivita Lawrence A and Lacivita Susan M
Purchase Details
Closed on
Jun 13, 2012
Sold by
Wardle Dale W
Bought by
Lacivita James A
Purchase Details
Closed on
Jan 1, 1990
Sold by
Middleton Ernest A
Bought by
Dale W Wardle
Create a Home Valuation Report for This Property
The Home Valuation Report is an in-depth analysis detailing your home's value as well as a comparison with similar homes in the area
Home Values in the Area
Average Home Value in this Area
Purchase History
| Date | Buyer | Sale Price | Title Company |
|---|---|---|---|
| Piros Brandon | -- | None Listed On Document | |
| Piros Brandon | $45,000 | None Available | |
| Lacivita Lawrence A | -- | None Available | |
| Lacivita Lawrence A | -- | None Available | |
| Lacivita James A | $43,667 | None Available | |
| Dale W Wardle | -- | -- |
Source: Public Records
Mortgage History
| Date | Status | Borrower | Loan Amount |
|---|---|---|---|
| Open | Piros Brandon | $40,000 |
Source: Public Records
Tax History Compared to Growth
Tax History
| Year | Tax Paid | Tax Assessment Tax Assessment Total Assessment is a certain percentage of the fair market value that is determined by local assessors to be the total taxable value of land and additions on the property. | Land | Improvement |
|---|---|---|---|---|
| 2024 | $1,987 | $34,240 | $9,350 | $24,890 |
| 2023 | $1,987 | $34,240 | $9,350 | $24,890 |
| 2022 | $1,540 | $23,630 | $8,680 | $14,950 |
| 2021 | $1,546 | $23,630 | $8,680 | $14,950 |
| 2020 | $1,552 | $23,630 | $8,680 | $14,950 |
| 2019 | $1,415 | $20,410 | $8,050 | $12,360 |
| 2018 | $1,374 | $20,410 | $8,050 | $12,360 |
| 2017 | $1,371 | $20,410 | $8,050 | $12,360 |
| 2016 | $978 | $15,260 | $8,050 | $7,210 |
| 2015 | $982 | $15,260 | $8,050 | $7,210 |
| 2014 | $963 | $15,260 | $8,050 | $7,210 |
| 2013 | $962 | $15,260 | $8,050 | $7,210 |
Source: Public Records
Map
Nearby Homes
- 1034 Doris Dr
- 381 Lauretta Ln
- 50 Clubhouse Dr
- 3397 Pothour Wheeler Rd
- 351 Elmwood Dr
- 430 E Park Ave
- 138 Moore St
- 1 Grandview Dr
- 1952 Hubbard Masury Rd
- 28 Spring St
- 88 Fetsko Rd
- 132 Drummond Ave
- 110 School St
- 312 W Park Ave
- 203 Hager St
- 160 Hager St
- 323 W Liberty St
- 124 Rebecca Ave
- 6982 Mcclure Rd
- 652 Meadowland Dr
- 7763 E Liberty St
- 7775 E Liberty St
- 2770 S Fox North Rd
- 7834 E Liberty St
- 2750 S Fox North Rd
- 2750 S Fox Rd N
- 2730 S Fox North Rd
- 2720 S Fox North Rd
- 7908 E Liberty St
- 2768 S Fox North Rd
- 2692 S Fox North Rd
- 7903 E Liberty St
- 7911 E Liberty St
- 2660 S Fox North Rd
- 2646 S Fox North Rd
- 2970 Schotten Rd
- 2612 S Fox North Rd
- 7963 E East Liberty St
- 2974 Schotten Rd
- 7963 E Liberty St