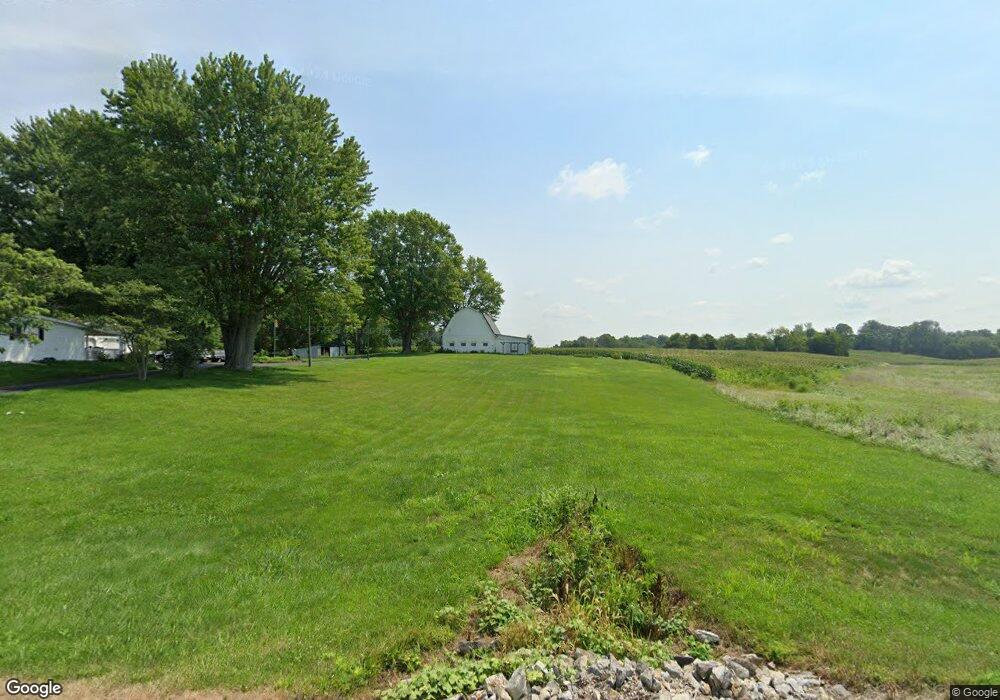
7796 S County Road 350 W Greensburg, IN 47240
Estimated Value: $267,542 - $306,000
3
Beds
1
Bath
1,420
Sq Ft
$205/Sq Ft
Est. Value
About This Home
This home is located at 7796 S County Road 350 W, Greensburg, IN 47240 and is currently estimated at $290,886, approximately $204 per square foot. 7796 S County Road 350 W is a home located in Decatur County with nearby schools including South Decatur Elementary School and South Decatur Junior/Senior High School.
Ownership History
Date
Name
Owned For
Owner Type
Purchase Details
Closed on
Aug 6, 2015
Sold by
Fountain Harry Lloyd and Fountain Harry Lloyd
Bought by
Phillips Cassandra R
Current Estimated Value
Home Financials for this Owner
Home Financials are based on the most recent Mortgage that was taken out on this home.
Original Mortgage
$152,040
Outstanding Balance
$119,579
Interest Rate
4.03%
Mortgage Type
New Conventional
Estimated Equity
$171,307
Purchase Details
Closed on
Oct 28, 2013
Sold by
Nixon Barbara
Bought by
Fountain Harry Lloyd and Fountain Harry Lloyd
Purchase Details
Closed on
Apr 6, 2012
Sold by
Duerstock Wayne J and Duerstock Dawn M
Bought by
Fountain Harry Lloyd and Nixon Barbara
Home Financials for this Owner
Home Financials are based on the most recent Mortgage that was taken out on this home.
Original Mortgage
$113,300
Interest Rate
3.9%
Mortgage Type
Stand Alone First
Create a Home Valuation Report for This Property
The Home Valuation Report is an in-depth analysis detailing your home's value as well as a comparison with similar homes in the area
Home Values in the Area
Average Home Value in this Area
Purchase History
| Date | Buyer | Sale Price | Title Company |
|---|---|---|---|
| Phillips Cassandra R | -- | Attorney | |
| Fountain Harry Lloyd | -- | -- | |
| Fountain Harry Lloyd | -- | -- |
Source: Public Records
Mortgage History
| Date | Status | Borrower | Loan Amount |
|---|---|---|---|
| Open | Phillips Cassandra R | $152,040 | |
| Previous Owner | Fountain Harry Lloyd | $113,300 |
Source: Public Records
Tax History Compared to Growth
Tax History
| Year | Tax Paid | Tax Assessment Tax Assessment Total Assessment is a certain percentage of the fair market value that is determined by local assessors to be the total taxable value of land and additions on the property. | Land | Improvement |
|---|---|---|---|---|
| 2024 | $1,174 | $206,300 | $35,300 | $171,000 |
| 2023 | $1,168 | $194,200 | $35,200 | $159,000 |
| 2022 | $1,125 | $181,100 | $35,200 | $145,900 |
| 2021 | $1,175 | $155,400 | $35,200 | $120,200 |
| 2020 | $876 | $136,700 | $33,100 | $103,600 |
| 2019 | $776 | $125,600 | $33,100 | $92,500 |
| 2018 | $674 | $125,900 | $33,100 | $92,800 |
| 2017 | $626 | $125,400 | $33,100 | $92,300 |
| 2016 | $731 | $134,400 | $30,500 | $103,900 |
| 2014 | $710 | $130,000 | $30,500 | $99,500 |
| 2013 | $715 | $122,600 | $30,500 | $92,100 |
Source: Public Records
Map
Nearby Homes
- 4281 W County Road 800 S
- 6838 S Mill St
- 7962 S State Road 3
- 11182 S Co Road 280 W
- 1816 W County Road 1000 S
- 4944 S County Road 240 W
- 11182 S County Road 280 W
- 506 E North St
- 508 Deer Run
- 503 E Bennett St
- 3852 W Co Road 1100 S
- 28 W Co Road 700 S
- 217 E Sycamore St
- 107 W Main St
- 0 W Co Rd 1100 S
- 5766 S Co Road 20 W
- 3058 W Co Road 1100 S
- 1017 W Main St
- 2855 S State Road 3
- 6440 W County Road 1300 S
- 7796 S Co Road 350 W
- 3404 W County Road 800 S
- 3461 W County Road 800 S
- 8031 S County Road 350 W
- 4281 W Co Road 800 S
- 3744 W Co Road 800 S
- 3240 W County Road 800 S
- 3240 W County Road 800 S
- 3241 W County Road 800 S
- 3399 W County Road 800 S
- 3309 W County Road 800 S
- 7509 S County Road 350 W
- 3744 W County Road 800 S
- W County Road 800 S
- 7274 S County Road 320 W
- 7383 S County Road 320 W
- 7254 S County Road 350 W
- 7239 S County Road 320 W
- 7278 S County Road 320 W