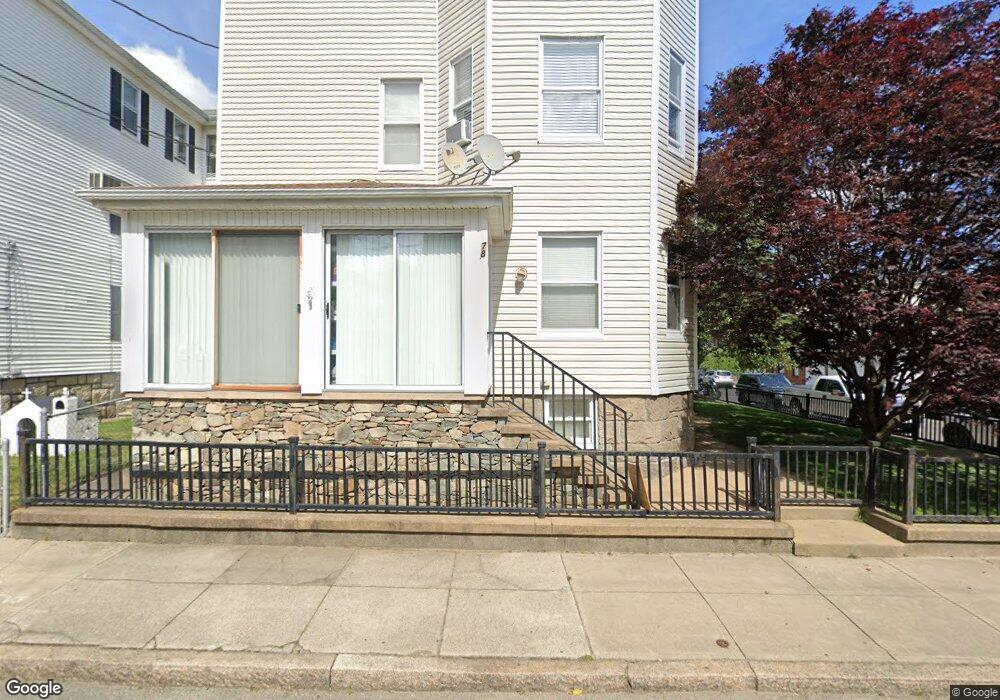
78 18th St Unit 3 Fall River, MA 02723
Flint NeighborhoodEstimated Value: $576,000 - $721,000
3
Beds
1
Bath
1,200
Sq Ft
$539/Sq Ft
Est. Value
About This Home
This home is located at 78 18th St Unit 3, Fall River, MA 02723 and is currently estimated at $647,086, approximately $539 per square foot. 78 18th St Unit 3 is a home located in Bristol County with nearby schools including Mary Fonseca Elementary School, Talbot Innovation School, and B M C Durfee High School.
Ownership History
Date
Name
Owned For
Owner Type
Purchase Details
Closed on
Jul 3, 2025
Sold by
Demello Henry and Demello Thomas
Bought by
3 Brothersformass Llc
Current Estimated Value
Purchase Details
Closed on
May 23, 2007
Sold by
Demello Henry
Bought by
Puim Ana Paula and Demello Michael
Purchase Details
Closed on
Apr 14, 2005
Sold by
Catalan Donna and Solomon Ernest
Bought by
Puim Ana Paula
Purchase Details
Closed on
Nov 9, 1989
Sold by
Martins Leontina
Bought by
Amaral Louis
Home Financials for this Owner
Home Financials are based on the most recent Mortgage that was taken out on this home.
Original Mortgage
$112,000
Interest Rate
10.03%
Mortgage Type
Purchase Money Mortgage
Create a Home Valuation Report for This Property
The Home Valuation Report is an in-depth analysis detailing your home's value as well as a comparison with similar homes in the area
Home Values in the Area
Average Home Value in this Area
Purchase History
| Date | Buyer | Sale Price | Title Company |
|---|---|---|---|
| 3 Brothersformass Llc | -- | -- | |
| 3 Brothersformass Llc | -- | -- | |
| Puim Ana Paula | -- | -- | |
| Demello Henry | -- | -- | |
| Puim Ana Paula | -- | -- | |
| Puim Ana Paula | -- | -- | |
| Amaral Louis | $140,000 | -- | |
| Amaral Louis | $140,000 | -- |
Source: Public Records
Mortgage History
| Date | Status | Borrower | Loan Amount |
|---|---|---|---|
| Previous Owner | Amaral Louis | $29,000 | |
| Previous Owner | Amaral Louis | $112,000 | |
| Previous Owner | Amaral Louis | $20,000 |
Source: Public Records
Tax History
| Year | Tax Paid | Tax Assessment Tax Assessment Total Assessment is a certain percentage of the fair market value that is determined by local assessors to be the total taxable value of land and additions on the property. | Land | Improvement |
|---|---|---|---|---|
| 2025 | $5,685 | $496,500 | $107,100 | $389,400 |
| 2024 | $5,445 | $473,900 | $103,200 | $370,700 |
| 2023 | $4,807 | $391,800 | $85,300 | $306,500 |
| 2022 | $4,282 | $339,300 | $81,200 | $258,100 |
| 2021 | $4,047 | $292,600 | $77,200 | $215,400 |
| 2020 | $3,647 | $252,400 | $76,100 | $176,300 |
| 2019 | $3,127 | $214,500 | $73,300 | $141,200 |
| 2018 | $3,019 | $206,500 | $79,400 | $127,100 |
| 2017 | $2,839 | $202,800 | $75,700 | $127,100 |
| 2016 | $2,787 | $204,500 | $80,500 | $124,000 |
| 2015 | $2,675 | $204,500 | $80,500 | $124,000 |
| 2014 | $2,686 | $213,500 | $78,100 | $135,400 |
Source: Public Records
Map
Nearby Homes
- 105 16th St
- 120 15th St Unit 5
- 869 Bedford St
- 84 Healy St
- 10 Carlisa Dr
- 847 Pleasant St
- 129 County St
- 992 Pine St
- 217 Plain St
- 218 Plain St
- 1155-1157 Pleasant St
- 884 Cherry St
- 243 Robeson St Unit 6
- 243 Robeson St Unit 3
- 273 Tremont St
- 88 Harrison St Unit 5
- 511 Bank St
- 1244 Pleasant St
- 70 Jencks St
- 243 Oak Grove Ave
Your Personal Tour Guide
Ask me questions while you tour the home.