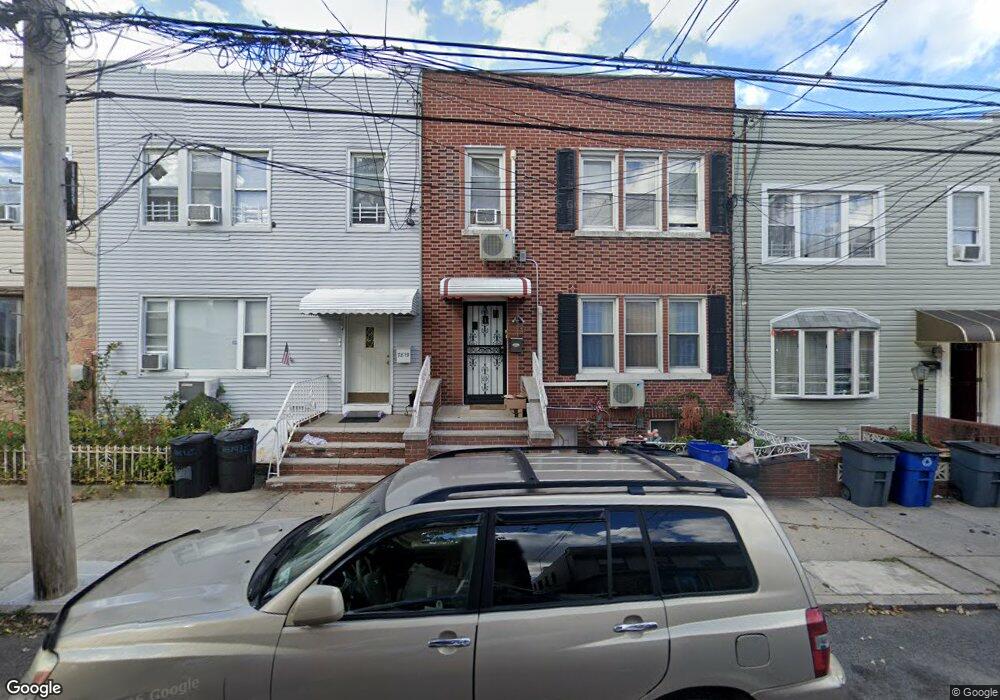
78-21 69th Ave Unit 2 Middle Village, NY 11379
Middle Village NeighborhoodEstimated Value: $927,277 - $1,058,000
3
Beds
1
Bath
1,000
Sq Ft
$1,004/Sq Ft
Est. Value
About This Home
This home is located at 78-21 69th Ave Unit 2, Middle Village, NY 11379 and is currently estimated at $1,003,569, approximately $1,003 per square foot. 78-21 69th Ave Unit 2 is a home located in Queens County with nearby schools including P.S. 87 - Middle Village, Queens Metropolitan High School, and Elm Community Charter School.
Ownership History
Date
Name
Owned For
Owner Type
Purchase Details
Closed on
Nov 25, 2020
Sold by
Tan Xin Hua
Bought by
Tan Lisha and Tan Xin Hua
Current Estimated Value
Home Financials for this Owner
Home Financials are based on the most recent Mortgage that was taken out on this home.
Original Mortgage
$470,000
Outstanding Balance
$418,440
Interest Rate
2.7%
Mortgage Type
Purchase Money Mortgage
Estimated Equity
$585,129
Purchase Details
Closed on
Jun 16, 2017
Sold by
Lzz Group Inc
Bought by
Tan Xin Hua
Home Financials for this Owner
Home Financials are based on the most recent Mortgage that was taken out on this home.
Original Mortgage
$480,000
Interest Rate
4.05%
Mortgage Type
Purchase Money Mortgage
Purchase Details
Closed on
May 1, 2015
Sold by
7821 69 Middle Village Inc
Bought by
Lzz Group Inc
Purchase Details
Closed on
Dec 5, 2014
Sold by
Krason Eugenia
Bought by
7821 69 Middle Village Inc
Purchase Details
Closed on
Sep 28, 2011
Sold by
Krason Eugenia and Krason Jan
Bought by
Krason Eugenia
Create a Home Valuation Report for This Property
The Home Valuation Report is an in-depth analysis detailing your home's value as well as a comparison with similar homes in the area
Home Values in the Area
Average Home Value in this Area
Purchase History
| Date | Buyer | Sale Price | Title Company |
|---|---|---|---|
| Tan Lisha | -- | -- | |
| Tan Lisha | -- | -- | |
| Tan Xin Hua | $760,000 | -- | |
| Tan Xin Hua | $760,000 | -- | |
| Lzz Group Inc | $624,000 | -- | |
| Lzz Group Inc | $624,000 | -- | |
| 7821 69 Middle Village Inc | $300,000 | -- | |
| 7821 69 Middle Village Inc | $300,000 | -- | |
| Krason Eugenia | -- | -- | |
| Krason Eugenia | -- | -- |
Source: Public Records
Mortgage History
| Date | Status | Borrower | Loan Amount |
|---|---|---|---|
| Open | Tan Lisha | $470,000 | |
| Closed | Tan Lisha | $470,000 | |
| Closed | Tan Xin Hua | $480,000 |
Source: Public Records
Tax History Compared to Growth
Tax History
| Year | Tax Paid | Tax Assessment Tax Assessment Total Assessment is a certain percentage of the fair market value that is determined by local assessors to be the total taxable value of land and additions on the property. | Land | Improvement |
|---|---|---|---|---|
| 2025 | $6,994 | $35,576 | $9,735 | $25,841 |
| 2024 | $6,994 | $34,824 | $9,302 | $25,522 |
| 2023 | $6,649 | $33,106 | $8,361 | $24,745 |
| 2022 | $6,265 | $49,080 | $14,760 | $34,320 |
| 2021 | $6,243 | $47,760 | $14,760 | $33,000 |
| 2020 | $6,275 | $52,500 | $14,760 | $37,740 |
| 2019 | $6,071 | $44,940 | $14,760 | $30,180 |
| 2018 | $5,624 | $27,588 | $9,109 | $18,479 |
| 2017 | $5,331 | $26,154 | $9,868 | $16,286 |
| 2016 | $4,942 | $26,154 | $9,868 | $16,286 |
| 2015 | $2,706 | $24,706 | $12,490 | $12,216 |
| 2014 | $2,706 | $24,184 | $14,198 | $9,986 |
Source: Public Records
Map
Nearby Homes
- 78-21 69th Ave Unit 1st Fl
- 78-21 69th Ave Unit 1 Fl
- 78-21 69th Ave Unit 1
- 78-21 69th Ave
- 7821 69th Ave
- 7821 69th Ave
- 7819 69th Ave
- 7823 69th Ave
- 7823 69th Ave
- 78-19 69th Ave
- 78-23 69th Ave
- 7823 69th Ave
- 7817 69th Ave
- 7827 69th Ave
- 7815 69th Ave
- 68-45 69 Ave
- 7813 69th Ave
- 7813 69th Ave
- 7813 69th Ave Unit 1
- 78-30 68th Rd