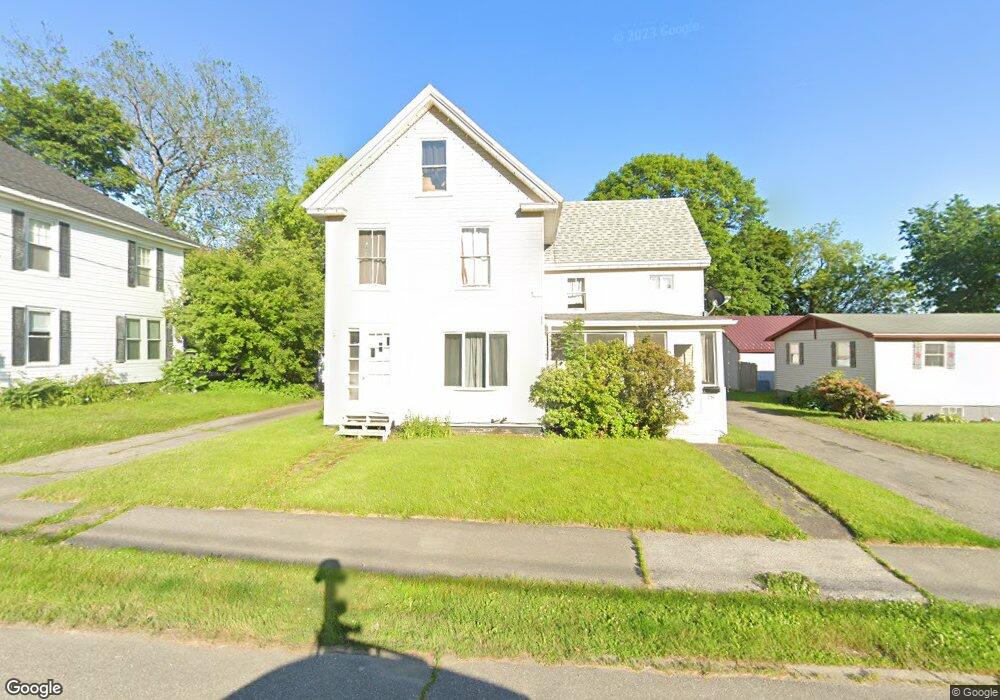
78 7th St Bangor, ME 04401
West Bangor NeighborhoodEstimated Value: $249,397 - $308,000
3
Beds
2
Baths
1,650
Sq Ft
$171/Sq Ft
Est. Value
About This Home
This home is located at 78 7th St, Bangor, ME 04401 and is currently estimated at $281,849, approximately $170 per square foot. 78 7th St is a home located in Penobscot County with nearby schools including Vine Street School, Fairmount School, and James F. Doughty School.
Ownership History
Date
Name
Owned For
Owner Type
Purchase Details
Closed on
Jul 25, 2019
Sold by
Bullock Jack
Bought by
Bullock Joshua and Bullock Jack
Current Estimated Value
Purchase Details
Closed on
Apr 30, 2010
Sold by
Merrill Lawrence E
Bought by
Bryant Jason
Purchase Details
Closed on
Jun 23, 2008
Sold by
Clifford Daniel E
Bought by
Federal National Mortgage Association
Create a Home Valuation Report for This Property
The Home Valuation Report is an in-depth analysis detailing your home's value as well as a comparison with similar homes in the area
Home Values in the Area
Average Home Value in this Area
Purchase History
| Date | Buyer | Sale Price | Title Company |
|---|---|---|---|
| Bullock Joshua | -- | -- | |
| Bullock Joshua | -- | -- | |
| Bryant Jason | -- | -- | |
| Federal National Mortgage Association | -- | -- | |
| Bryant Jason | -- | -- | |
| Federal National Mortgage Association | -- | -- |
Source: Public Records
Mortgage History
| Date | Status | Borrower | Loan Amount |
|---|---|---|---|
| Previous Owner | Federal National Mortgage Association | $0 | |
| Closed | Federal National Mortgage Association | $0 |
Source: Public Records
Tax History
| Year | Tax Paid | Tax Assessment Tax Assessment Total Assessment is a certain percentage of the fair market value that is determined by local assessors to be the total taxable value of land and additions on the property. | Land | Improvement |
|---|---|---|---|---|
| 2024 | $3,471 | $187,100 | $23,400 | $163,700 |
| 2023 | $3,278 | $171,200 | $23,400 | $147,800 |
| 2022 | $3,056 | $149,800 | $23,400 | $126,400 |
| 2021 | $2,921 | $131,000 | $21,600 | $109,400 |
| 2020 | $2,205 | $122,700 | $21,000 | $101,700 |
| 2019 | $2,735 | $118,900 | $21,000 | $97,900 |
| 2018 | $2,660 | $115,900 | $21,000 | $94,900 |
| 2017 | $2,562 | $113,600 | $21,000 | $92,600 |
| 2016 | $2,824 | $111,200 | $21,000 | $90,200 |
| 2015 | $2,634 | $120,000 | $21,000 | $99,000 |
| 2014 | $2,568 | $117,800 | $21,000 | $96,800 |
| 2013 | $2,450 | $117,800 | $21,000 | $96,800 |
Source: Public Records
Map
Nearby Homes
Your Personal Tour Guide
Ask me questions while you tour the home.