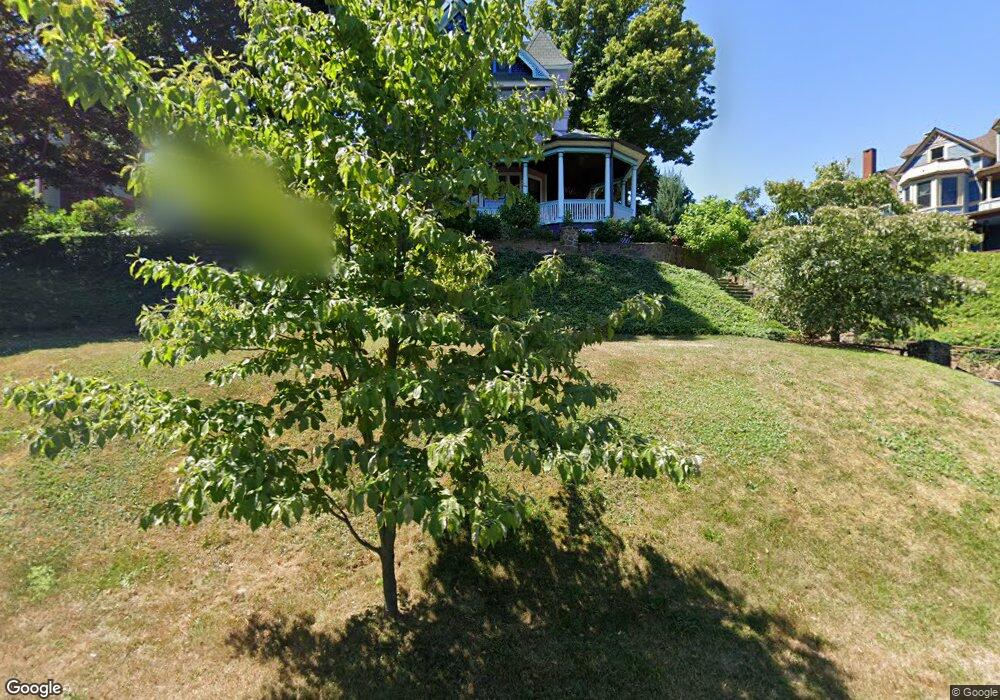
78 8th Ave Atlantic Highlands, NJ 07716
Estimated Value: $871,000 - $1,172,000
4
Beds
3
Baths
625
Sq Ft
$1,577/Sq Ft
Est. Value
About This Home
This home is located at 78 8th Ave, Atlantic Highlands, NJ 07716 and is currently estimated at $985,880, approximately $1,577 per square foot. 78 8th Ave is a home located in Monmouth County with nearby schools including Atlantic Highlands Elementary School, Henry Hudson Regional School, and Mountain Hill School.
Ownership History
Date
Name
Owned For
Owner Type
Purchase Details
Closed on
Oct 11, 2011
Sold by
Ferris Michele M and Brown David L
Bought by
Kirsh Debra
Current Estimated Value
Home Financials for this Owner
Home Financials are based on the most recent Mortgage that was taken out on this home.
Original Mortgage
$310,500
Outstanding Balance
$213,299
Interest Rate
4.25%
Mortgage Type
New Conventional
Estimated Equity
$772,581
Purchase Details
Closed on
Jan 31, 2000
Sold by
Telinbacco Joseph
Bought by
Ferris Dorothy
Create a Home Valuation Report for This Property
The Home Valuation Report is an in-depth analysis detailing your home's value as well as a comparison with similar homes in the area
Home Values in the Area
Average Home Value in this Area
Purchase History
| Date | Buyer | Sale Price | Title Company |
|---|---|---|---|
| Kirsh Debra | $517,500 | Commonwealth Land Title Insu | |
| Ferris Dorothy | $382,000 | -- |
Source: Public Records
Mortgage History
| Date | Status | Borrower | Loan Amount |
|---|---|---|---|
| Open | Kirsh Debra | $310,500 |
Source: Public Records
Tax History Compared to Growth
Tax History
| Year | Tax Paid | Tax Assessment Tax Assessment Total Assessment is a certain percentage of the fair market value that is determined by local assessors to be the total taxable value of land and additions on the property. | Land | Improvement |
|---|---|---|---|---|
| 2025 | $10,806 | $672,900 | $405,300 | $267,600 |
| 2024 | $10,093 | $649,000 | $386,300 | $262,700 |
| 2023 | $10,093 | $590,900 | $334,300 | $256,600 |
| 2022 | $10,485 | $580,600 | $336,300 | $244,300 |
| 2021 | $10,485 | $533,600 | $321,200 | $212,400 |
| 2020 | $10,548 | $530,600 | $318,200 | $212,400 |
| 2019 | $10,485 | $529,300 | $318,200 | $211,100 |
| 2018 | $10,187 | $519,500 | $318,200 | $201,300 |
| 2017 | $10,268 | $386,300 | $196,600 | $189,700 |
| 2016 | $10,125 | $386,300 | $196,600 | $189,700 |
| 2015 | $9,862 | $386,300 | $196,600 | $189,700 |
| 2014 | $9,527 | $377,900 | $188,200 | $189,700 |
Source: Public Records
Map
Nearby Homes
- 61 E Washington Ave
- 90 E Lincoln Ave
- 73 3rd Ave
- 59 Asbury Ave
- 16 E Garfield Ave
- 12 E Garfield Ave
- 8 E Garfield Ave
- 4-10 E Garfield Ave
- 193 Ocean Blvd
- 7 Harbor View Dr
- 38 East Ave
- 11 Brant Dr Unit Lot 5.10
- 52 W Highland Ave
- 58 W Highland Ave
- 54 W Washington Ave
- 18 Middletown Ave
- 1 Cameron Cir
- 41 South Ave
- 6998 Prospect Ave
- 7100 Prospect Ave