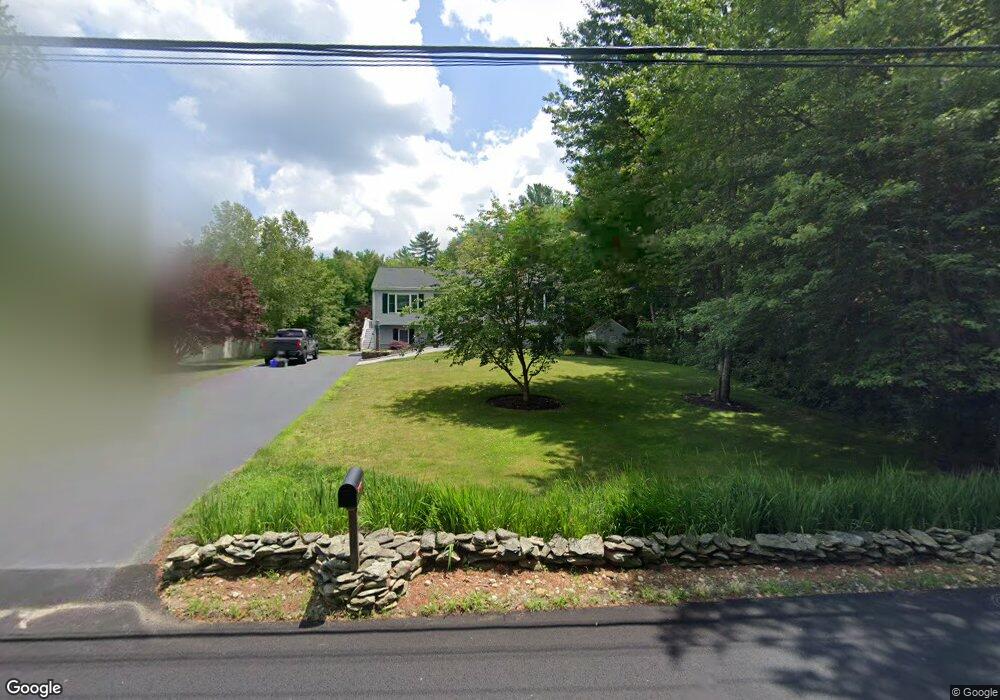
78 Anthony St Berkley, MA 02779
Estimated Value: $519,000 - $602,000
3
Beds
2
Baths
1,180
Sq Ft
$477/Sq Ft
Est. Value
About This Home
This home is located at 78 Anthony St, Berkley, MA 02779 and is currently estimated at $563,297, approximately $477 per square foot. 78 Anthony St is a home located in Bristol County with nearby schools including Berkley Community School.
Ownership History
Date
Name
Owned For
Owner Type
Purchase Details
Closed on
Mar 3, 2022
Sold by
Decosta Joseph A and Decosta Elizabeth A
Bought by
Decosta Ft
Current Estimated Value
Purchase Details
Closed on
Aug 21, 1998
Sold by
Dove Rt and Knight Kris
Bought by
Decosta Joseph and Decosta Elizabeth
Purchase Details
Closed on
Oct 20, 1997
Sold by
Nunes Lily J
Bought by
Dove Rt and Knight Kris W
Create a Home Valuation Report for This Property
The Home Valuation Report is an in-depth analysis detailing your home's value as well as a comparison with similar homes in the area
Purchase History
| Date | Buyer | Sale Price | Title Company |
|---|---|---|---|
| Decosta Ft | -- | None Available | |
| Decosta Joseph | $141,400 | -- | |
| Dove Rt | $40,000 | -- |
Source: Public Records
Mortgage History
| Date | Status | Borrower | Loan Amount |
|---|---|---|---|
| Previous Owner | Dove Rt | $218,000 | |
| Previous Owner | Dove Rt | $215,000 | |
| Previous Owner | Dove Rt | $184,000 |
Source: Public Records
Tax History
| Year | Tax Paid | Tax Assessment Tax Assessment Total Assessment is a certain percentage of the fair market value that is determined by local assessors to be the total taxable value of land and additions on the property. | Land | Improvement |
|---|---|---|---|---|
| 2025 | $59 | $488,500 | $149,600 | $338,900 |
| 2024 | $5,661 | $454,700 | $128,800 | $325,900 |
| 2023 | $5,423 | $410,200 | $128,800 | $281,400 |
| 2022 | $5,155 | $374,900 | $112,000 | $262,900 |
| 2021 | $5,011 | $350,900 | $106,700 | $244,200 |
| 2020 | $4,840 | $333,100 | $94,200 | $238,900 |
| 2019 | $4,699 | $321,000 | $94,200 | $226,800 |
| 2018 | $4,266 | $304,300 | $90,600 | $213,700 |
| 2017 | $4,161 | $291,000 | $101,500 | $189,500 |
| 2016 | $4,022 | $271,000 | $101,500 | $169,500 |
| 2015 | $3,772 | $271,200 | $101,500 | $169,700 |
| 2014 | $3,610 | $281,800 | $110,200 | $171,600 |
Source: Public Records
Map
Nearby Homes
- Lot B Old Anthony St
- 106 Seymour St
- 23 Elmwood Dr
- 73 Seymour St
- 10 W Cudworth Ave
- 0 Anthony St
- 0 Sammys Ln
- 66 S Main St
- 143 Morrison Rd
- 1969 County St
- 7 Eric Dr
- LOT 0 B Hudson Dr Unit B
- LOT 0 B Hudson Dr Unit B
- 2 Bc Ln
- 2 Lima Ln
- LOT 2A Hudson Dr Unit 2A
- 5 Hadley Heights Way
- 16 Water St Unit C
- 16 Water St Unit A
- 16 Water St Unit B
Your Personal Tour Guide
Ask me questions while you tour the home.