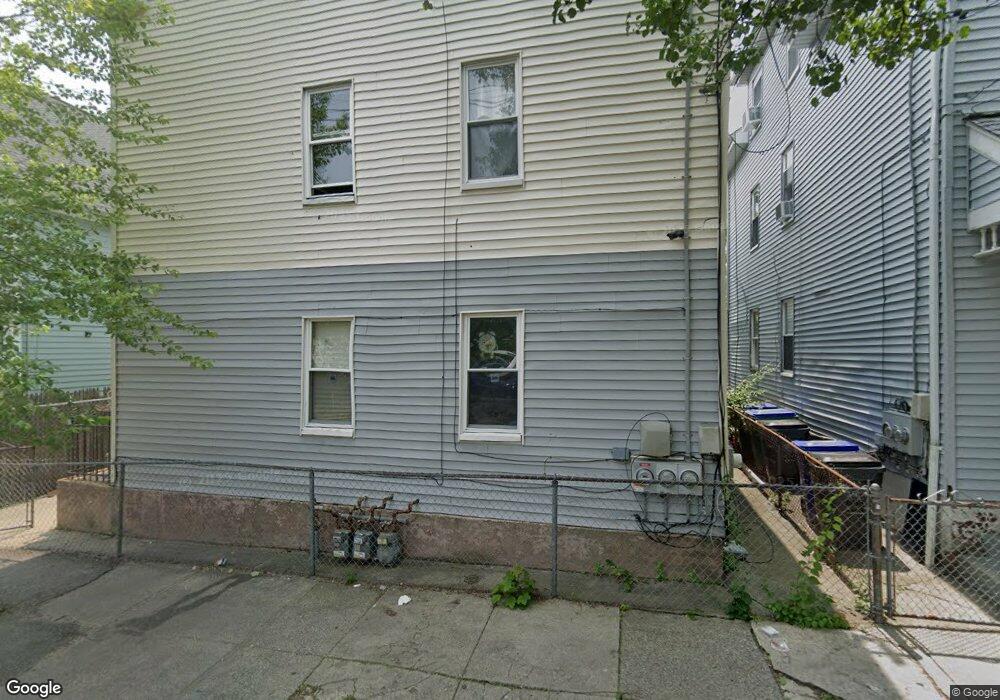
78 Appleton St Providence, RI 02909
Olneyville NeighborhoodEstimated Value: $548,095 - $640,000
11
Beds
3
Baths
2,869
Sq Ft
$209/Sq Ft
Est. Value
About This Home
This home is located at 78 Appleton St, Providence, RI 02909 and is currently estimated at $599,274, approximately $208 per square foot. 78 Appleton St is a home located in Providence County with nearby schools including Paul Cuffee Middle School, Blessed Sacrament School, and Mount Pleasant Academy.
Ownership History
Date
Name
Owned For
Owner Type
Purchase Details
Closed on
Mar 7, 2006
Sold by
Duran Angela
Bought by
Rodrigues Lourdes
Current Estimated Value
Purchase Details
Closed on
Dec 16, 2004
Sold by
Perez Stalin
Bought by
Duran Angela
Purchase Details
Closed on
Jul 7, 2003
Sold by
Garcia Reina
Bought by
Perez Stalin
Purchase Details
Closed on
Jul 15, 1998
Sold by
N E Neighborhood Dev
Bought by
Corona Arelis
Purchase Details
Closed on
May 17, 1996
Sold by
Lacera James A
Bought by
Quevedo Elsa
Purchase Details
Closed on
Jun 28, 1990
Sold by
Sims Tr William H
Bought by
Dechristofaro Maria
Create a Home Valuation Report for This Property
The Home Valuation Report is an in-depth analysis detailing your home's value as well as a comparison with similar homes in the area
Home Values in the Area
Average Home Value in this Area
Purchase History
| Date | Buyer | Sale Price | Title Company |
|---|---|---|---|
| Rodrigues Lourdes | $320,000 | -- | |
| Duran Angela | $300,000 | -- | |
| Perez Stalin | $110,000 | -- | |
| Corona Arelis | $73,000 | -- | |
| N E Neighborhood Dev | $50,000 | -- | |
| Quevedo Elsa | $82,000 | -- | |
| Dechristofaro Maria | $17,000 | -- | |
| Dechristofaro Maria | $17,000 | -- |
Source: Public Records
Mortgage History
| Date | Status | Borrower | Loan Amount |
|---|---|---|---|
| Open | Dechristofaro Maria | $342,720 | |
| Closed | Dechristofaro Maria | $344,085 |
Source: Public Records
Tax History
| Year | Tax Paid | Tax Assessment Tax Assessment Total Assessment is a certain percentage of the fair market value that is determined by local assessors to be the total taxable value of land and additions on the property. | Land | Improvement |
|---|---|---|---|---|
| 2025 | $3,878 | $513,600 | $149,100 | $364,500 |
| 2024 | $5,824 | $317,400 | $72,500 | $244,900 |
| 2023 | $5,824 | $317,400 | $72,500 | $244,900 |
| 2022 | $5,650 | $317,400 | $72,500 | $244,900 |
| 2021 | $4,433 | $180,500 | $34,600 | $145,900 |
| 2020 | $4,433 | $180,500 | $34,600 | $145,900 |
| 2019 | $4,433 | $180,500 | $34,600 | $145,900 |
| 2018 | $3,618 | $113,200 | $28,600 | $84,600 |
| 2017 | $3,618 | $113,200 | $28,600 | $84,600 |
| 2016 | $3,618 | $113,200 | $28,600 | $84,600 |
| 2015 | $3,320 | $100,300 | $34,300 | $66,000 |
| 2014 | $3,385 | $100,300 | $34,300 | $66,000 |
| 2013 | $3,385 | $100,300 | $34,300 | $66,000 |
Source: Public Records
Map
Nearby Homes
Your Personal Tour Guide
Ask me questions while you tour the home.