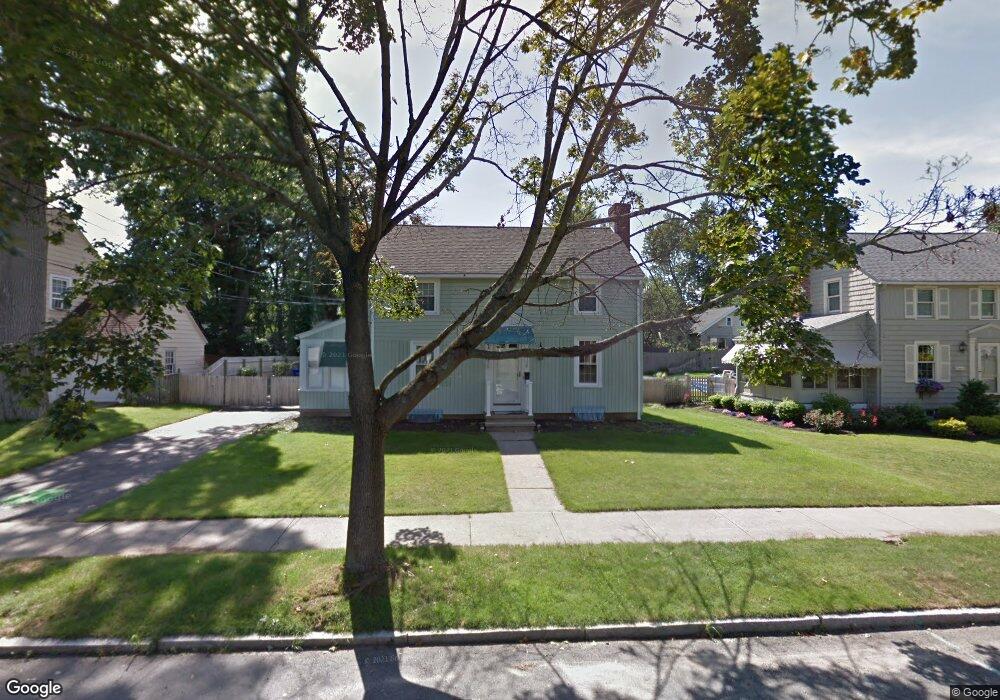
78 Audubon St Springfield, MA 01108
Forest Park NeighborhoodEstimated Value: $280,000 - $349,000
2
Beds
2
Baths
1,408
Sq Ft
$216/Sq Ft
Est. Value
About This Home
This home is located at 78 Audubon St, Springfield, MA 01108 and is currently estimated at $303,634, approximately $215 per square foot. 78 Audubon St is a home located in Hampden County with nearby schools including Washington Elementary School, M Marcus Kiley Middle, and High School Of Commerce.
Ownership History
Date
Name
Owned For
Owner Type
Purchase Details
Closed on
Dec 6, 2019
Sold by
Goldrick James D
Bought by
Goldrick James D and Goldrick Judith A
Current Estimated Value
Purchase Details
Closed on
Sep 27, 1991
Sold by
Damario John A and Damario Carolyn M
Bought by
Goldrick James D
Home Financials for this Owner
Home Financials are based on the most recent Mortgage that was taken out on this home.
Original Mortgage
$98,600
Interest Rate
9.1%
Mortgage Type
Purchase Money Mortgage
Create a Home Valuation Report for This Property
The Home Valuation Report is an in-depth analysis detailing your home's value as well as a comparison with similar homes in the area
Home Values in the Area
Average Home Value in this Area
Purchase History
| Date | Buyer | Sale Price | Title Company |
|---|---|---|---|
| Goldrick James D | -- | None Available | |
| Goldrick James D | $114,000 | -- |
Source: Public Records
Mortgage History
| Date | Status | Borrower | Loan Amount |
|---|---|---|---|
| Previous Owner | Goldrick James D | $98,600 | |
| Previous Owner | Goldrick James D | $37,000 |
Source: Public Records
Tax History Compared to Growth
Tax History
| Year | Tax Paid | Tax Assessment Tax Assessment Total Assessment is a certain percentage of the fair market value that is determined by local assessors to be the total taxable value of land and additions on the property. | Land | Improvement |
|---|---|---|---|---|
| 2025 | $3,914 | $249,600 | $38,700 | $210,900 |
| 2024 | $3,984 | $248,100 | $38,700 | $209,400 |
| 2023 | $3,749 | $219,900 | $36,900 | $183,000 |
| 2022 | $3,401 | $180,700 | $36,900 | $143,800 |
| 2021 | $3,145 | $166,400 | $33,600 | $132,800 |
| 2020 | $3,115 | $159,500 | $33,600 | $125,900 |
| 2019 | $3,159 | $160,500 | $33,600 | $126,900 |
| 2018 | $2,903 | $147,500 | $33,600 | $113,900 |
| 2017 | $2,855 | $145,200 | $33,600 | $111,600 |
| 2016 | $2,931 | $149,100 | $33,600 | $115,500 |
| 2015 | $2,846 | $144,700 | $33,600 | $111,100 |
Source: Public Records
Map
Nearby Homes