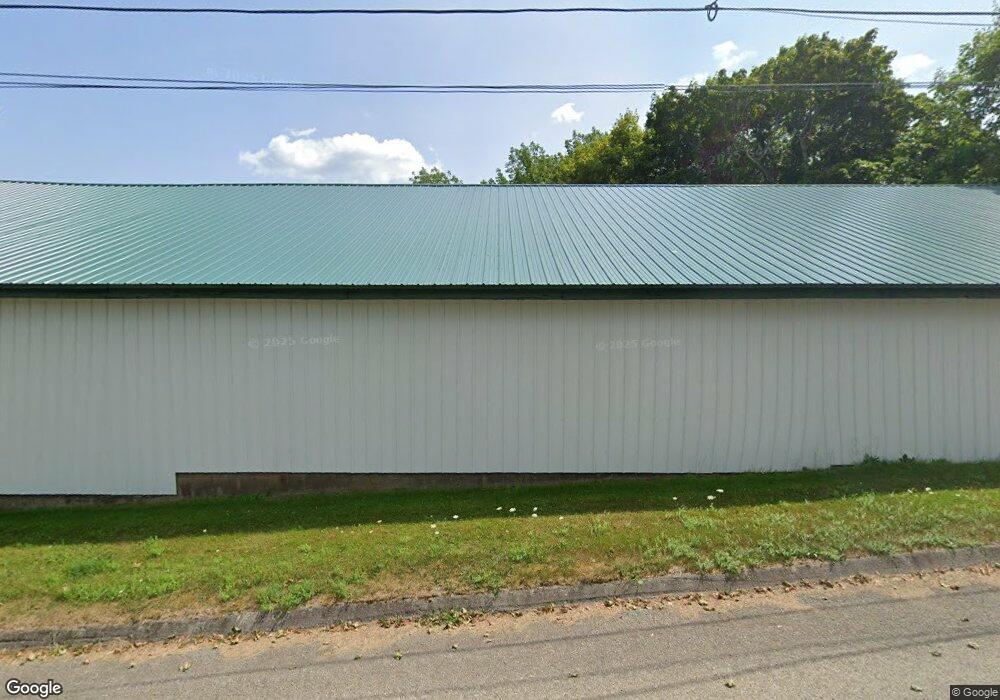
78 Barker St Calais, ME 04619
Estimated Value: $115,000 - $224,832
2
Beds
3
Baths
572
Sq Ft
$312/Sq Ft
Est. Value
About This Home
This home is located at 78 Barker St, Calais, ME 04619 and is currently estimated at $178,458, approximately $311 per square foot. 78 Barker St is a home with nearby schools including Calais Elementary School and Calais Middle/High School.
Ownership History
Date
Name
Owned For
Owner Type
Purchase Details
Closed on
Dec 22, 2022
Sold by
Wartman Cindy
Bought by
Lursen James M and Fletcher Molly J
Current Estimated Value
Home Financials for this Owner
Home Financials are based on the most recent Mortgage that was taken out on this home.
Original Mortgage
$195,395
Outstanding Balance
$189,670
Interest Rate
7.08%
Mortgage Type
FHA
Estimated Equity
-$11,212
Create a Home Valuation Report for This Property
The Home Valuation Report is an in-depth analysis detailing your home's value as well as a comparison with similar homes in the area
Home Values in the Area
Average Home Value in this Area
Purchase History
| Date | Buyer | Sale Price | Title Company |
|---|---|---|---|
| Lursen James M | $199,000 | None Available |
Source: Public Records
Mortgage History
| Date | Status | Borrower | Loan Amount |
|---|---|---|---|
| Open | Lursen James M | $195,395 |
Source: Public Records
Tax History Compared to Growth
Tax History
| Year | Tax Paid | Tax Assessment Tax Assessment Total Assessment is a certain percentage of the fair market value that is determined by local assessors to be the total taxable value of land and additions on the property. | Land | Improvement |
|---|---|---|---|---|
| 2024 | $2,019 | $134,600 | $16,100 | $118,500 |
| 2023 | $1,974 | $116,100 | $13,900 | $102,200 |
| 2022 | $1,782 | $93,800 | $11,200 | $82,600 |
| 2021 | $1,944 | $90,000 | $10,800 | $79,200 |
| 2020 | $1,946 | $76,900 | $9,200 | $67,700 |
| 2019 | $1,946 | $76,900 | $9,200 | $67,700 |
| 2018 | $1,946 | $76,900 | $9,200 | $67,700 |
| 2017 | $1,946 | $76,900 | $9,200 | $67,700 |
| 2016 | $1,946 | $76,900 | $9,200 | $67,700 |
| 2015 | $1,837 | $72,600 | $9,200 | $63,400 |
| 2014 | $1,837 | $72,600 | $9,200 | $63,400 |
| 2013 | $1,837 | $72,600 | $9,200 | $63,400 |
Source: Public Records
Map
Nearby Homes