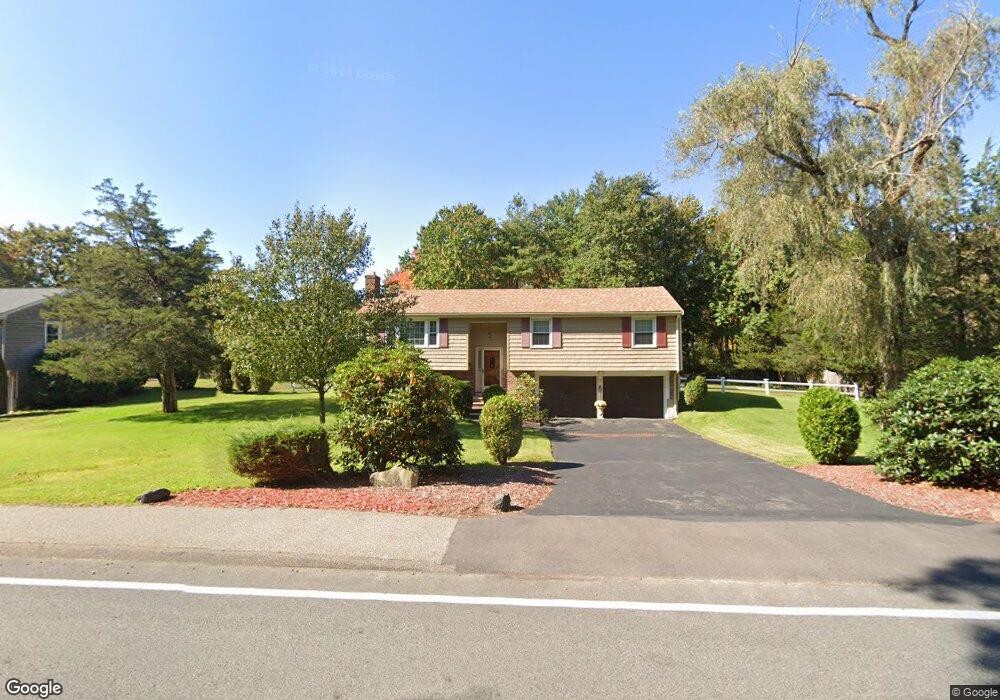
78 Beach St Foxboro, MA 02035
Estimated Value: $639,000 - $732,000
3
Beds
3
Baths
1,236
Sq Ft
$550/Sq Ft
Est. Value
About This Home
This home is located at 78 Beach St, Foxboro, MA 02035 and is currently estimated at $679,892, approximately $550 per square foot. 78 Beach St is a home located in Norfolk County with nearby schools including Foxborough High School, Foxborough Regional Charter School, and The Sage School.
Ownership History
Date
Name
Owned For
Owner Type
Purchase Details
Closed on
Oct 24, 2018
Sold by
Zhang Qingchun and Wang Yuan
Bought by
Xu Haiyan
Current Estimated Value
Home Financials for this Owner
Home Financials are based on the most recent Mortgage that was taken out on this home.
Original Mortgage
$598,500
Outstanding Balance
$547,393
Interest Rate
7.13%
Mortgage Type
New Conventional
Estimated Equity
$132,499
Purchase Details
Closed on
Oct 29, 2014
Sold by
Morris Irt
Bought by
Zhang Qingchun and Wang Yuan
Purchase Details
Closed on
Sep 14, 1984
Bought by
Parlow Edward T
Create a Home Valuation Report for This Property
The Home Valuation Report is an in-depth analysis detailing your home's value as well as a comparison with similar homes in the area
Home Values in the Area
Average Home Value in this Area
Purchase History
| Date | Buyer | Sale Price | Title Company |
|---|---|---|---|
| Xu Haiyan | $730,000 | -- | |
| Zhang Qingchun | $600,000 | -- | |
| Parlow Edward T | $93,500 | -- |
Source: Public Records
Mortgage History
| Date | Status | Borrower | Loan Amount |
|---|---|---|---|
| Open | Xu Haiyan | $598,500 |
Source: Public Records
Tax History Compared to Growth
Tax History
| Year | Tax Paid | Tax Assessment Tax Assessment Total Assessment is a certain percentage of the fair market value that is determined by local assessors to be the total taxable value of land and additions on the property. | Land | Improvement |
|---|---|---|---|---|
| 2025 | $7,073 | $535,000 | $217,700 | $317,300 |
| 2024 | $6,756 | $500,100 | $217,700 | $282,400 |
| 2023 | $6,529 | $459,500 | $207,300 | $252,200 |
| 2022 | $6,341 | $436,700 | $198,300 | $238,400 |
| 2021 | $5,878 | $398,800 | $180,300 | $218,500 |
| 2020 | $5,472 | $375,600 | $180,300 | $195,300 |
| 2019 | $5,221 | $355,200 | $171,700 | $183,500 |
| 2018 | $5,082 | $348,800 | $171,700 | $177,100 |
| 2017 | $4,959 | $329,700 | $160,500 | $169,200 |
| 2016 | $4,913 | $331,500 | $154,400 | $177,100 |
| 2015 | $4,720 | $310,700 | $130,400 | $180,300 |
| 2014 | $4,618 | $308,100 | $127,800 | $180,300 |
Source: Public Records
Map
Nearby Homes