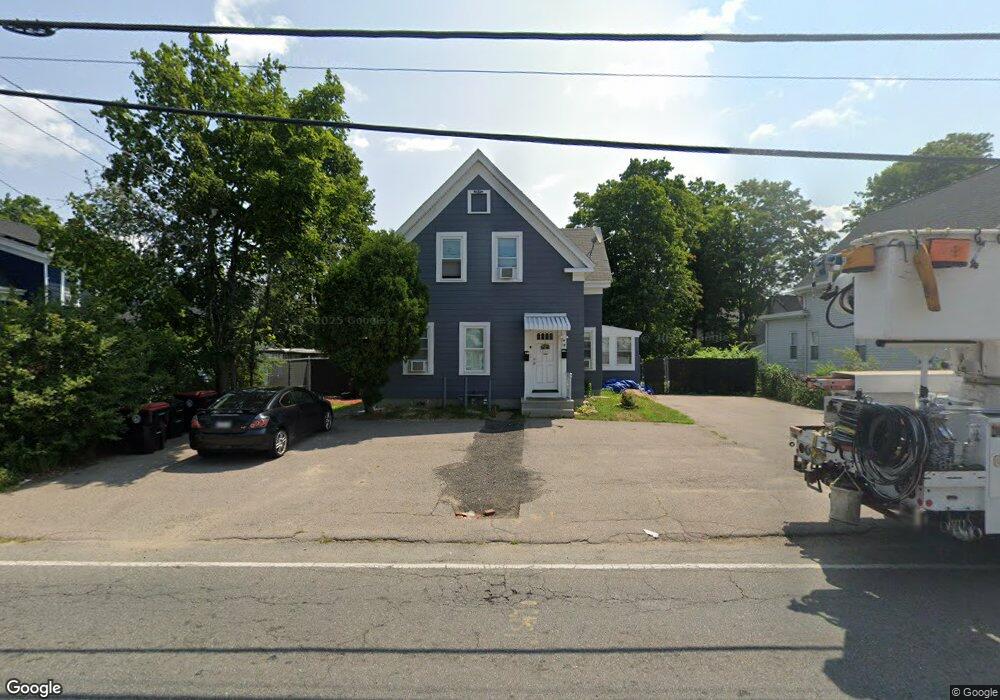
78 Cary St Unit 1 Brockton, MA 02302
Estimated Value: $473,000 - $700,168
3
Beds
1
Bath
1,300
Sq Ft
$472/Sq Ft
Est. Value
About This Home
This home is located at 78 Cary St Unit 1, Brockton, MA 02302 and is currently estimated at $613,042, approximately $471 per square foot. 78 Cary St Unit 1 is a home located in Plymouth County with nearby schools including Brookfield Elementary School, Downey Elementary School, and Mary E. Baker Elementary School.
Ownership History
Date
Name
Owned For
Owner Type
Purchase Details
Closed on
Mar 12, 2025
Sold by
Boriken Properties Llc
Bought by
Varela Manuel V and Varela Luisa M
Current Estimated Value
Home Financials for this Owner
Home Financials are based on the most recent Mortgage that was taken out on this home.
Original Mortgage
$653,937
Outstanding Balance
$648,506
Interest Rate
5.87%
Mortgage Type
FHA
Estimated Equity
-$35,464
Purchase Details
Closed on
Nov 19, 2024
Sold by
De Lvalle Maximino Est and De Lvalle
Bought by
Eclipse Capital Llc
Home Financials for this Owner
Home Financials are based on the most recent Mortgage that was taken out on this home.
Original Mortgage
$441,000
Interest Rate
6.32%
Mortgage Type
Purchase Money Mortgage
Purchase Details
Closed on
Nov 18, 2024
Sold by
Eclipse Capital Llc
Bought by
First Landing Invs Llc
Home Financials for this Owner
Home Financials are based on the most recent Mortgage that was taken out on this home.
Original Mortgage
$441,000
Interest Rate
6.32%
Mortgage Type
Purchase Money Mortgage
Purchase Details
Closed on
Nov 14, 2024
Sold by
First Landing Invs Llc
Bought by
Boroken Properties Llc
Home Financials for this Owner
Home Financials are based on the most recent Mortgage that was taken out on this home.
Original Mortgage
$441,000
Interest Rate
6.32%
Mortgage Type
Purchase Money Mortgage
Purchase Details
Closed on
Apr 9, 2014
Sold by
167 Newbury Street Rt and Elman
Bought by
Delvalle Maximino
Home Financials for this Owner
Home Financials are based on the most recent Mortgage that was taken out on this home.
Original Mortgage
$227,797
Interest Rate
4.12%
Mortgage Type
FHA
Purchase Details
Closed on
Mar 6, 2013
Sold by
Fnma
Bought by
167 Newbury Street Rt and Elman
Home Financials for this Owner
Home Financials are based on the most recent Mortgage that was taken out on this home.
Original Mortgage
$78,750
Interest Rate
3.45%
Mortgage Type
New Conventional
Purchase Details
Closed on
Dec 19, 2011
Sold by
Murphy Marie J and Phh Mortgage Corp
Bought by
Federal National Mortgage Association
Create a Home Valuation Report for This Property
The Home Valuation Report is an in-depth analysis detailing your home's value as well as a comparison with similar homes in the area
Home Values in the Area
Average Home Value in this Area
Purchase History
| Date | Buyer | Sale Price | Title Company |
|---|---|---|---|
| Varela Manuel V | $666,000 | None Available | |
| Varela Manuel V | $666,000 | None Available | |
| Eclipse Capital Llc | $420,273 | None Available | |
| Eclipse Capital Llc | $420,273 | None Available | |
| Eclipse Capital Llc | $420,273 | None Available | |
| First Landing Invs Llc | $450,000 | None Available | |
| First Landing Invs Llc | $450,000 | None Available | |
| First Landing Invs Llc | $450,000 | None Available | |
| Boroken Properties Llc | $469,300 | None Available | |
| Boroken Properties Llc | $469,300 | None Available | |
| Boroken Properties Llc | $469,300 | None Available | |
| Delvalle Maximino | $232,000 | -- | |
| Delvalle Maximino | $232,000 | -- | |
| 167 Newbury Street Rt | $87,500 | -- | |
| 167 Newbury Street Rt | $87,500 | -- | |
| Federal National Mortgage Association | $133,121 | -- | |
| Federal National Mortgage Association | $133,121 | -- |
Source: Public Records
Mortgage History
| Date | Status | Borrower | Loan Amount |
|---|---|---|---|
| Open | Varela Manuel V | $653,937 | |
| Closed | Varela Manuel V | $653,937 | |
| Previous Owner | First Landing Invs Llc | $441,000 | |
| Previous Owner | Delvalle Maximino | $227,797 | |
| Previous Owner | 167 Newbury Street Rt | $78,750 |
Source: Public Records
Tax History Compared to Growth
Tax History
| Year | Tax Paid | Tax Assessment Tax Assessment Total Assessment is a certain percentage of the fair market value that is determined by local assessors to be the total taxable value of land and additions on the property. | Land | Improvement |
|---|---|---|---|---|
| 2025 | $6,541 | $540,100 | $140,000 | $400,100 |
| 2024 | $6,309 | $524,900 | $140,000 | $384,900 |
| 2023 | $6,103 | $470,200 | $104,000 | $366,200 |
| 2022 | $5,894 | $421,900 | $94,600 | $327,300 |
| 2021 | $5,148 | $355,000 | $78,500 | $276,500 |
| 2020 | $4,542 | $299,800 | $73,600 | $226,200 |
| 2019 | $4,872 | $313,500 | $71,800 | $241,700 |
| 2018 | $4,270 | $265,900 | $71,800 | $194,100 |
| 2017 | $3,748 | $232,800 | $71,800 | $161,000 |
| 2016 | $3,746 | $215,800 | $69,600 | $146,200 |
| 2015 | $2,626 | $144,700 | $69,600 | $75,100 |
| 2014 | $2,283 | $125,900 | $69,600 | $56,300 |
Source: Public Records
Map
Nearby Homes