Estimated Value: $691,620 - $749,000
4
Beds
3
Baths
2,122
Sq Ft
$336/Sq Ft
Est. Value
About This Home
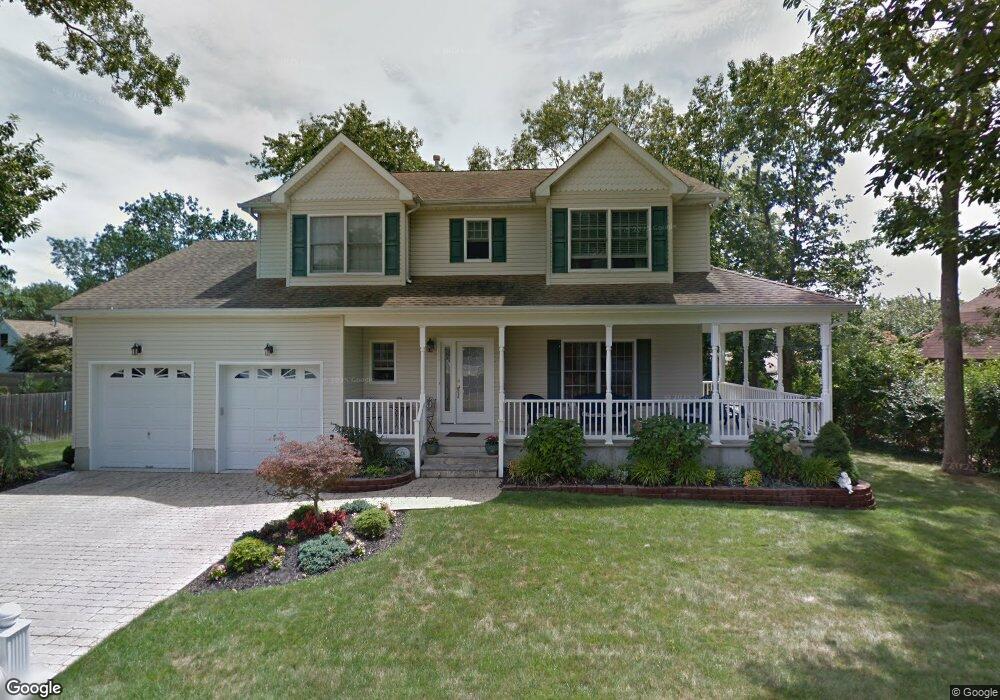
This home is located at 78 Chestnut Ave, Brick, NJ 08724 and is currently estimated at $712,405, approximately $335 per square foot. 78 Chestnut Ave is a home located in Ocean County with nearby schools including Lanes Mill Elementary School, Veterans Memorial Middle School, and Brick Township Memorial High School.
Ownership History
Date
Name
Owned For
Owner Type
Purchase Details
Closed on
Aug 13, 2004
Sold by
John Quartaro & Son Custom Builders Inc
Bought by
Penta Garry Anthony and Penta Kathleen Rita
Current Estimated Value
Home Financials for this Owner
Home Financials are based on the most recent Mortgage that was taken out on this home.
Original Mortgage
$170,000
Outstanding Balance
$84,469
Interest Rate
6.03%
Mortgage Type
Fannie Mae Freddie Mac
Estimated Equity
$627,936
Create a Home Valuation Report for This Property
The Home Valuation Report is an in-depth analysis detailing your home's value as well as a comparison with similar homes in the area
Home Values in the Area
Average Home Value in this Area
Purchase History
| Date | Buyer | Sale Price | Title Company |
|---|---|---|---|
| Penta Garry Anthony | $425,000 | None Available |
Source: Public Records
Mortgage History
| Date | Status | Borrower | Loan Amount |
|---|---|---|---|
| Open | Penta Garry Anthony | $170,000 |
Source: Public Records
Tax History Compared to Growth
Tax History
| Year | Tax Paid | Tax Assessment Tax Assessment Total Assessment is a certain percentage of the fair market value that is determined by local assessors to be the total taxable value of land and additions on the property. | Land | Improvement |
|---|---|---|---|---|
| 2025 | $8,535 | $327,000 | $132,500 | $194,500 |
| 2024 | $8,100 | $327,000 | $132,500 | $194,500 |
| 2023 | $7,982 | $327,000 | $132,500 | $194,500 |
| 2022 | $7,982 | $327,000 | $132,500 | $194,500 |
| 2021 | $7,815 | $327,000 | $132,500 | $194,500 |
| 2020 | $7,714 | $327,000 | $132,500 | $194,500 |
| 2019 | $7,577 | $327,000 | $132,500 | $194,500 |
| 2018 | $7,403 | $327,000 | $132,500 | $194,500 |
| 2017 | $7,204 | $327,000 | $132,500 | $194,500 |
| 2016 | $7,165 | $327,000 | $132,500 | $194,500 |
| 2015 | $6,978 | $327,000 | $132,500 | $194,500 |
| 2014 | $6,919 | $327,000 | $132,500 | $194,500 |
Source: Public Records
Map
Nearby Homes