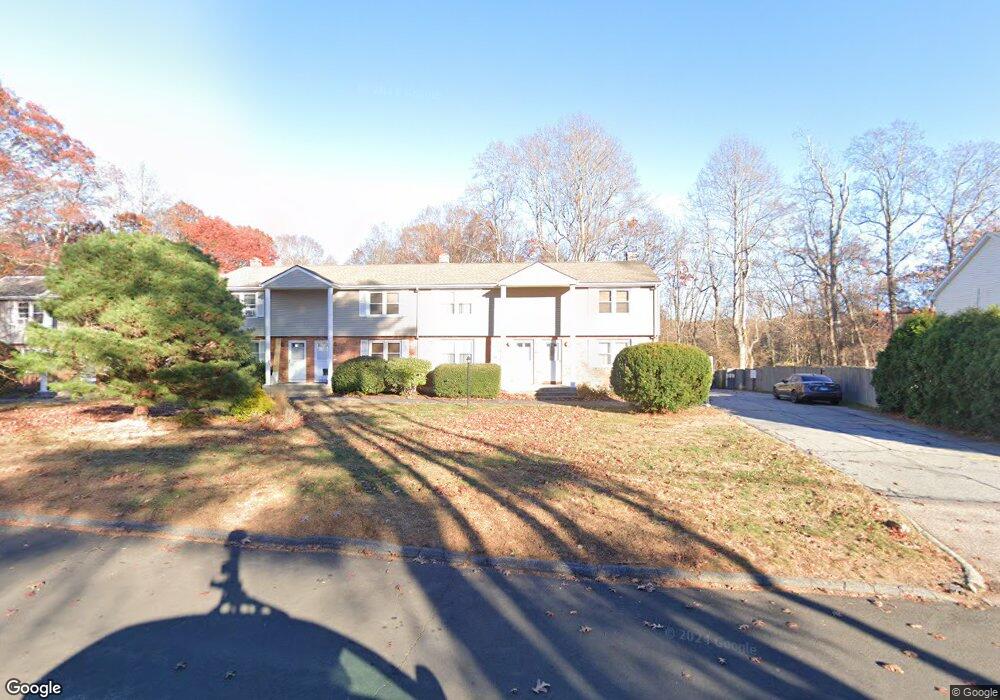
78 Corey Ln Unit 11 Niantic, CT 06357
Estimated Value: $224,000 - $240,000
2
Beds
1
Bath
980
Sq Ft
$237/Sq Ft
Est. Value
About This Home
This home is located at 78 Corey Ln Unit 11, Niantic, CT 06357 and is currently estimated at $231,912, approximately $236 per square foot. 78 Corey Ln Unit 11 is a home located in New London County with nearby schools including East Lyme Middle School, East Lyme High School, and The Light House Voc-Ed Center.
Ownership History
Date
Name
Owned For
Owner Type
Purchase Details
Closed on
Oct 8, 2021
Sold by
Payne Darlene A
Bought by
Michaud Donald E
Current Estimated Value
Home Financials for this Owner
Home Financials are based on the most recent Mortgage that was taken out on this home.
Original Mortgage
$145,500
Outstanding Balance
$132,682
Interest Rate
2.8%
Mortgage Type
Stand Alone Refi Refinance Of Original Loan
Estimated Equity
$99,230
Purchase Details
Closed on
Feb 14, 1995
Sold by
Ross Glenn K and Ross John R
Bought by
Swanick David J and Swanick Ruth
Home Financials for this Owner
Home Financials are based on the most recent Mortgage that was taken out on this home.
Original Mortgage
$54,300
Interest Rate
9.18%
Mortgage Type
Unknown
Create a Home Valuation Report for This Property
The Home Valuation Report is an in-depth analysis detailing your home's value as well as a comparison with similar homes in the area
Home Values in the Area
Average Home Value in this Area
Purchase History
| Date | Buyer | Sale Price | Title Company |
|---|---|---|---|
| Michaud Donald E | $152,500 | None Available | |
| Michaud Donald E | $152,500 | None Available | |
| Swanick David J | $72,500 | -- | |
| Swanick David J | $72,500 | -- |
Source: Public Records
Mortgage History
| Date | Status | Borrower | Loan Amount |
|---|---|---|---|
| Open | Michaud Donald E | $145,500 | |
| Closed | Michaud Donald E | $145,500 | |
| Previous Owner | Swanick David J | $71,400 | |
| Previous Owner | Swanick David J | $60,000 | |
| Previous Owner | Swanick David J | $54,500 | |
| Previous Owner | Swanick David J | $54,300 |
Source: Public Records
Tax History Compared to Growth
Tax History
| Year | Tax Paid | Tax Assessment Tax Assessment Total Assessment is a certain percentage of the fair market value that is determined by local assessors to be the total taxable value of land and additions on the property. | Land | Improvement |
|---|---|---|---|---|
| 2025 | $2,621 | $93,590 | $0 | $93,590 |
| 2024 | $2,466 | $93,590 | $0 | $93,590 |
| 2023 | $2,329 | $93,590 | $0 | $93,590 |
| 2022 | $2,231 | $93,590 | $0 | $93,590 |
| 2021 | $2,181 | $76,510 | $0 | $76,510 |
| 2020 | $2,170 | $76,510 | $0 | $76,510 |
| 2019 | $2,157 | $76,510 | $0 | $76,510 |
| 2018 | $2,093 | $76,510 | $0 | $76,510 |
| 2017 | $2,002 | $76,510 | $0 | $76,510 |
| 2016 | $2,318 | $91,420 | $0 | $91,420 |
| 2015 | $2,259 | $91,420 | $0 | $91,420 |
| 2014 | $2,197 | $91,420 | $0 | $91,420 |
Source: Public Records
Map
Nearby Homes
- 78 Corey Ln Unit 9
- 97 W Main St Unit 24
- 127 Black Point Rd Unit 7
- 46 Old Black Point Rd
- 47 Village Crossing Unit 47
- 46 Village Crossing Unit 46
- 48 Village Crossing Unit 48
- 23 Central Ave
- 68-70 Black Point Rd
- 37 Stoneywood Dr
- 43 Village Crossing Unit 43
- 15 Freedom Way Unit 92
- 3 Pattagansett Ct
- 9 Columbus Ave
- 5 Attawan Ave
- 15 Griswold Rd
- 223 Giants Neck Rd
- 38 Hope St Unit 1307
- 43 Attawan Ave
- 48 Billow Rd
- 78 Corey Ln Unit 10
- 78 Corey Ln Unit 6
- 78 Corey Ln Unit 1
- 78 Corey Ln Unit 5
- 78 Corey Ln Unit 12
- 78 Corey Ln Unit 13
- 78 Corey Ln Unit 15
- 78 Corey Ln Unit 14
- 78 Corey Ln Unit 16
- 78 Corey Ln Unit 4
- 78 Corey Ln Unit 8
- 78 Corey Ln Unit 7
- 78 Corey Ln Unit 3
- 78 Corey Ln Unit 2
- 80 Corey Ln
- 82 Corey Ln
- 77 Corey Ln
- 84 Corey Ln
- 72 Corey Ln