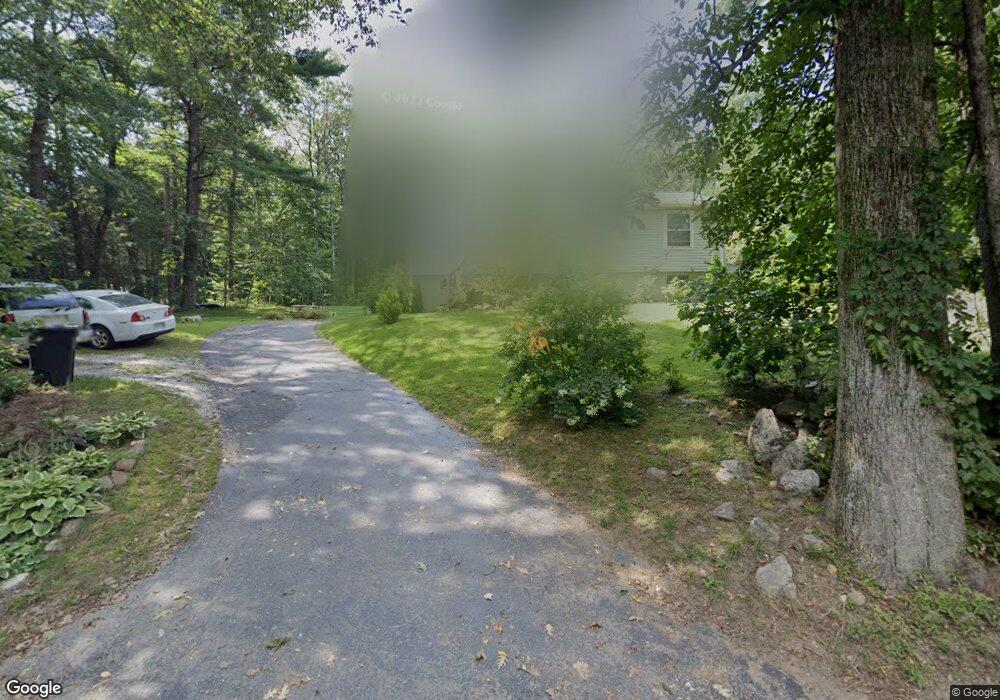
78 Denfield Rd Unit 1 Charlton, MA 01507
Estimated Value: $317,000 - $385,000
3
Beds
1
Bath
1,680
Sq Ft
$210/Sq Ft
Est. Value
About This Home
This home is located at 78 Denfield Rd Unit 1, Charlton, MA 01507 and is currently estimated at $352,201, approximately $209 per square foot. 78 Denfield Rd Unit 1 is a home located in Worcester County with nearby schools including Shepherd Hill Regional High School, Trinity Catholic Academy, and ViewPoint Christian Academy.
Ownership History
Date
Name
Owned For
Owner Type
Purchase Details
Closed on
Apr 3, 2013
Sold by
Santos John
Bought by
Fannon Kevin J and Markely Angela N
Current Estimated Value
Home Financials for this Owner
Home Financials are based on the most recent Mortgage that was taken out on this home.
Original Mortgage
$153,061
Outstanding Balance
$108,577
Interest Rate
3.58%
Mortgage Type
New Conventional
Estimated Equity
$243,624
Purchase Details
Closed on
Apr 30, 2004
Sold by
Grampetro Debra A
Bought by
Santos John
Home Financials for this Owner
Home Financials are based on the most recent Mortgage that was taken out on this home.
Original Mortgage
$180,500
Interest Rate
5.36%
Mortgage Type
Purchase Money Mortgage
Create a Home Valuation Report for This Property
The Home Valuation Report is an in-depth analysis detailing your home's value as well as a comparison with similar homes in the area
Home Values in the Area
Average Home Value in this Area
Purchase History
| Date | Buyer | Sale Price | Title Company |
|---|---|---|---|
| Fannon Kevin J | $150,000 | -- | |
| Fannon Kevin J | $150,000 | -- | |
| Fannon Kevin J | $150,000 | -- | |
| Santos John | $190,000 | -- | |
| Santos John | $190,000 | -- |
Source: Public Records
Mortgage History
| Date | Status | Borrower | Loan Amount |
|---|---|---|---|
| Open | Fannon Kevin J | $153,061 | |
| Closed | Fannon Kevin J | $153,061 | |
| Previous Owner | Santos John | $180,500 | |
| Previous Owner | Santos John | $6,500 |
Source: Public Records
Tax History Compared to Growth
Tax History
| Year | Tax Paid | Tax Assessment Tax Assessment Total Assessment is a certain percentage of the fair market value that is determined by local assessors to be the total taxable value of land and additions on the property. | Land | Improvement |
|---|---|---|---|---|
| 2025 | $3,217 | $289,000 | $82,500 | $206,500 |
| 2024 | $3,128 | $275,800 | $82,500 | $193,300 |
| 2023 | $3,095 | $254,300 | $79,800 | $174,500 |
| 2022 | $2,938 | $221,100 | $72,600 | $148,500 |
| 2021 | $2,921 | $194,600 | $68,800 | $125,800 |
| 2020 | $2,865 | $191,800 | $66,000 | $125,800 |
| 2019 | $2,833 | $191,800 | $66,000 | $125,800 |
| 2018 | $2,589 | $191,800 | $66,000 | $125,800 |
| 2017 | $2,503 | $177,500 | $60,500 | $117,000 |
| 2016 | $2,446 | $177,500 | $60,500 | $117,000 |
| 2015 | $2,382 | $177,500 | $60,500 | $117,000 |
| 2014 | $2,337 | $184,600 | $66,200 | $118,400 |
Source: Public Records
Map
Nearby Homes
- 298 Torrey Rd
- 796 Charlton St
- 876 Worcester St
- 0 Blood Rd
- Lot 7 Harrington Rd
- 643 Charlton St
- 9 Piehl Dr
- 613 Charlton St
- 0 Sandersdale Rd
- 10 Harrington Rd
- 412 Charlton St
- 423 Worcester St
- 421 Charlton St
- 60 Saundersdale Rd
- 22 Prindle Hill Rd
- 60 Guelphwood Rd
- 79 Fairlawn Ave
- 16 Sandersdale Rd
- 219 Charlton St
- 97 Worcester St