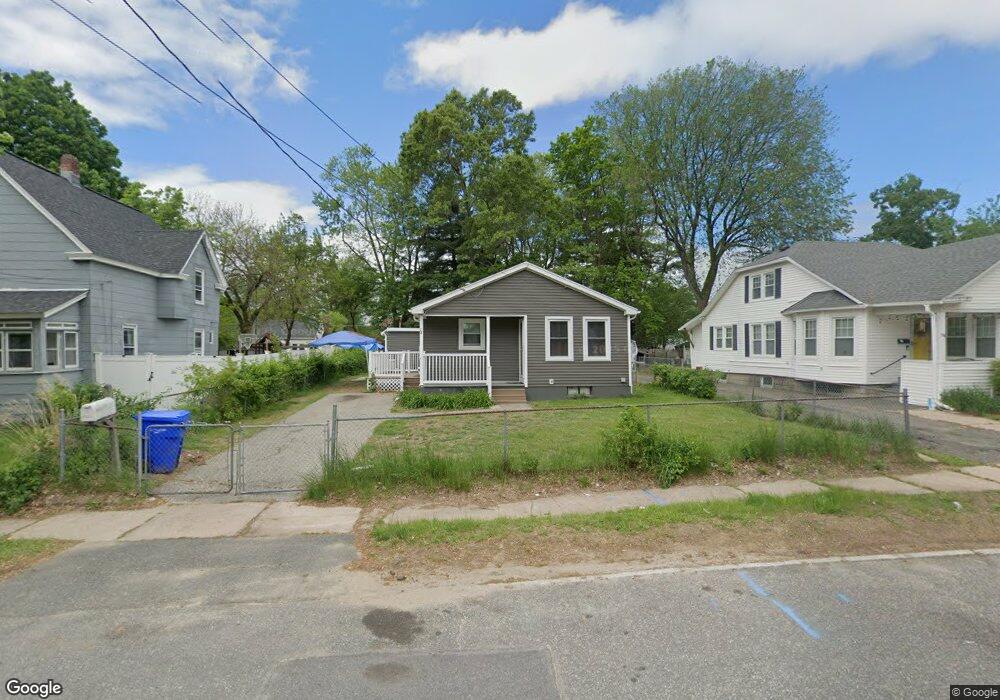
78 Denver St Springfield, MA 01109
Pine Point NeighborhoodEstimated Value: $247,000 - $287,000
3
Beds
2
Baths
1,080
Sq Ft
$247/Sq Ft
Est. Value
About This Home
This home is located at 78 Denver St, Springfield, MA 01109 and is currently estimated at $267,262, approximately $247 per square foot. 78 Denver St is a home located in Hampden County with nearby schools including Thomas M Balliet Elementary School, John J Duggan Middle, and Roger L. Putnam Vocational Technical Academy.
Ownership History
Date
Name
Owned For
Owner Type
Purchase Details
Closed on
Jun 23, 2010
Sold by
Bank Of New York Mello
Bought by
Guilbe William G
Current Estimated Value
Home Financials for this Owner
Home Financials are based on the most recent Mortgage that was taken out on this home.
Original Mortgage
$94,724
Outstanding Balance
$64,350
Interest Rate
5.25%
Mortgage Type
FHA
Estimated Equity
$202,912
Purchase Details
Closed on
Mar 24, 2009
Sold by
Countrywide Home Loans
Bought by
Bank Of New York
Purchase Details
Closed on
May 12, 2006
Sold by
King Gloria and Wiggins Gloria
Bought by
Wiggins Gloria
Home Financials for this Owner
Home Financials are based on the most recent Mortgage that was taken out on this home.
Original Mortgage
$116,800
Interest Rate
6.4%
Mortgage Type
Purchase Money Mortgage
Create a Home Valuation Report for This Property
The Home Valuation Report is an in-depth analysis detailing your home's value as well as a comparison with similar homes in the area
Home Values in the Area
Average Home Value in this Area
Purchase History
| Date | Buyer | Sale Price | Title Company |
|---|---|---|---|
| Guilbe William G | $96,000 | -- | |
| Bank Of New York | $97,750 | -- | |
| Wiggins Gloria | -- | -- |
Source: Public Records
Mortgage History
| Date | Status | Borrower | Loan Amount |
|---|---|---|---|
| Open | Guilbe William G | $94,724 | |
| Previous Owner | Wiggins Gloria | $116,800 |
Source: Public Records
Tax History
| Year | Tax Paid | Tax Assessment Tax Assessment Total Assessment is a certain percentage of the fair market value that is determined by local assessors to be the total taxable value of land and additions on the property. | Land | Improvement |
|---|---|---|---|---|
| 2025 | $3,531 | $225,200 | $40,700 | $184,500 |
| 2024 | $3,578 | $222,800 | $33,900 | $188,900 |
| 2023 | $3,671 | $215,300 | $30,800 | $184,500 |
| 2022 | $3,009 | $159,900 | $28,800 | $131,100 |
| 2021 | $3,094 | $163,700 | $26,200 | $137,500 |
| 2020 | $2,631 | $134,700 | $26,200 | $108,500 |
| 2019 | $2,566 | $130,400 | $26,200 | $104,200 |
| 2018 | $2,535 | $128,800 | $26,200 | $102,600 |
| 2017 | $2,572 | $130,800 | $24,200 | $106,600 |
| 2016 | $2,336 | $118,800 | $24,200 | $94,600 |
| 2015 | $2,254 | $114,600 | $24,200 | $90,400 |
Source: Public Records
Map
Nearby Homes
Your Personal Tour Guide
Ask me questions while you tour the home.