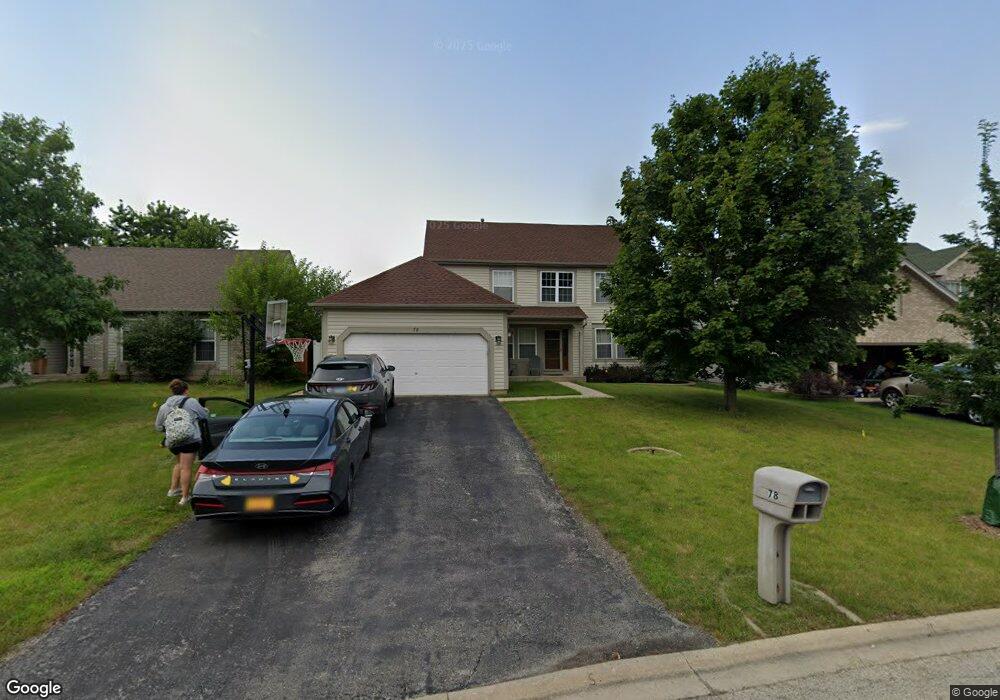
78 E Brittany Ln Hainesville, IL 60030
Estimated Value: $372,000 - $387,000
3
Beds
4
Baths
1,826
Sq Ft
$208/Sq Ft
Est. Value
About This Home
This home is located at 78 E Brittany Ln, Hainesville, IL 60030 and is currently estimated at $378,956, approximately $207 per square foot. 78 E Brittany Ln is a home located in Lake County with nearby schools including Prairieview School, Frederick School, and Grayslake Middle School.
Ownership History
Date
Name
Owned For
Owner Type
Purchase Details
Closed on
Oct 26, 2011
Sold by
Mcgowan Douglas G and Mcgowan Elizabeth C
Bought by
Mcgowan Douglas G and Mcgowan Elizabeth C
Current Estimated Value
Purchase Details
Closed on
Nov 13, 2001
Sold by
Mcgowan John H and Mcgowan Douglas G
Bought by
Mcgowan Douglas G and Azzaline Elizabeth C
Home Financials for this Owner
Home Financials are based on the most recent Mortgage that was taken out on this home.
Original Mortgage
$163,050
Outstanding Balance
$63,164
Interest Rate
6.6%
Estimated Equity
$315,792
Purchase Details
Closed on
Feb 19, 1998
Sold by
U S Shelter Group Inc
Bought by
Mcgowan Douglas G and Mcgowan John H
Home Financials for this Owner
Home Financials are based on the most recent Mortgage that was taken out on this home.
Original Mortgage
$169,500
Interest Rate
7.12%
Create a Home Valuation Report for This Property
The Home Valuation Report is an in-depth analysis detailing your home's value as well as a comparison with similar homes in the area
Home Values in the Area
Average Home Value in this Area
Purchase History
| Date | Buyer | Sale Price | Title Company |
|---|---|---|---|
| Mcgowan Douglas G | -- | None Available | |
| Mcgowan Douglas G | -- | First American Title | |
| Mcgowan Douglas G | $178,500 | Chicago Title Insurance Co |
Source: Public Records
Mortgage History
| Date | Status | Borrower | Loan Amount |
|---|---|---|---|
| Open | Mcgowan Douglas G | $163,050 | |
| Closed | Mcgowan Douglas G | $169,500 |
Source: Public Records
Tax History Compared to Growth
Tax History
| Year | Tax Paid | Tax Assessment Tax Assessment Total Assessment is a certain percentage of the fair market value that is determined by local assessors to be the total taxable value of land and additions on the property. | Land | Improvement |
|---|---|---|---|---|
| 2024 | $9,784 | $98,536 | $16,594 | $81,942 |
| 2023 | $8,790 | $90,433 | $15,229 | $75,204 |
| 2022 | $8,790 | $78,559 | $11,769 | $66,790 |
| 2021 | $8,704 | $75,508 | $11,312 | $64,196 |
| 2020 | $9,328 | $76,619 | $10,763 | $65,856 |
| 2019 | $9,016 | $73,509 | $10,326 | $63,183 |
| 2018 | $9,428 | $76,424 | $15,380 | $61,044 |
| 2017 | $9,412 | $71,888 | $14,467 | $57,421 |
| 2016 | $8,948 | $66,361 | $13,355 | $53,006 |
| 2015 | $8,707 | $60,626 | $12,201 | $48,425 |
| 2014 | $8,801 | $60,607 | $11,221 | $49,386 |
| 2012 | $8,726 | $63,297 | $11,719 | $51,578 |
Source: Public Records
Map
Nearby Homes
- 448 N Patriot Dr Unit 705
- 4 W Tall Oak Dr
- 375 N Tower Dr Unit 1202
- 372 White Tail Dr
- 582 Holiday Ln Unit 472
- 159 E Elk Ct
- 113 E Big Horn Dr
- 606 N Triumph Ct Unit 236
- 91 W Big Horn Dr Unit 151
- 319 Grandview Dr
- 304 E Willow Dr
- 565 Jeffrey Ave
- 34069 N Hainesville Rd
- 230 N Alleghany Rd
- 121 Highmoor Dr
- 123 E Pineview Dr
- 337 Woodland Dr Unit 6
- 408 Bellevue Dr
- 26155 W Il Route 120
- 536 Arbor Dr
- 68 E Brittany Ln
- 86 E Brittany Ln
- 96 E Brittany Ln
- 309 N Patriot Dr Unit 1806E
- 60 E Brittany Ln
- 311 N Patriot Dr Unit 1805C
- 311 N Patriot Dr Unit 311
- 313 N Patriot Dr Unit 1804
- 69 E Brittany Ln
- 104 E Brittany Ln
- 87 E Brittany Ln
- 331 N Patriot Dr Unit 1701
- 315 N Patriot Dr Unit 1803
- 329 N Patriot Dr Unit 1702
- 226 Stillwater Dr Unit 2
- 317 N Patriot Dr Unit 1802
- 95 E Brittany Ln
- 327 N Patriot Dr Unit 1703D
- 325 N Patriot Dr Unit 1740K
- 319 N Patriot Dr Unit 1801