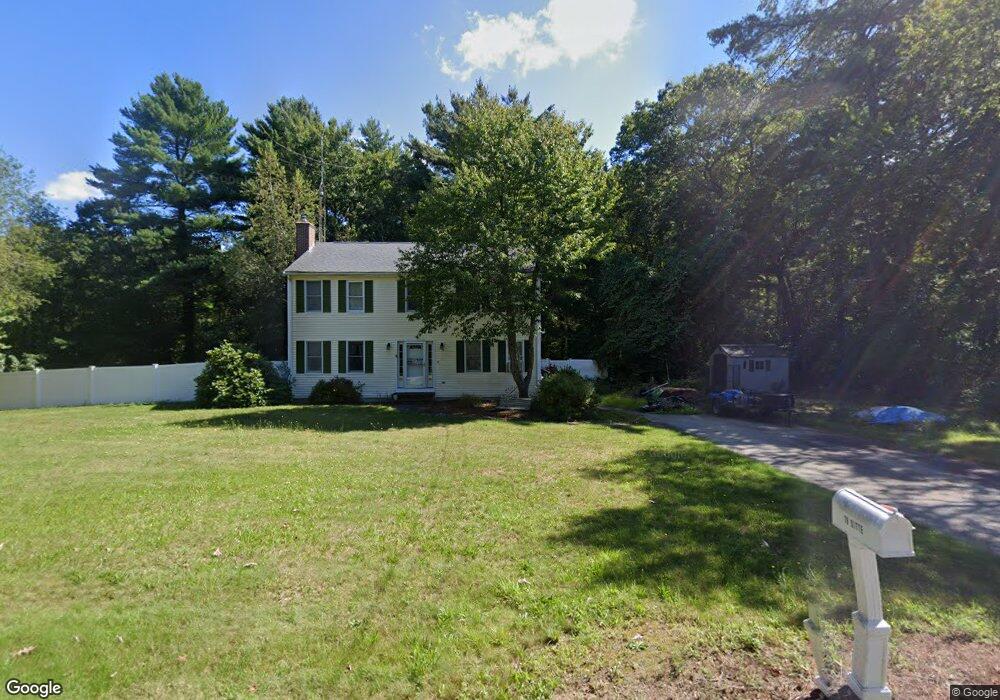
78 E Hodges St Unit 78 Norton, MA 02766
Estimated Value: $542,000 - $655,000
3
Beds
3
Baths
1,872
Sq Ft
$330/Sq Ft
Est. Value
About This Home
This home is located at 78 E Hodges St Unit 78, Norton, MA 02766 and is currently estimated at $617,776, approximately $330 per square foot. 78 E Hodges St Unit 78 is a home located in Bristol County with nearby schools including J.C. Solmonese Elementary School, Henri A. Yelle Elementary School, and Norton Middle School.
Ownership History
Date
Name
Owned For
Owner Type
Purchase Details
Closed on
Jul 27, 2022
Sold by
Sitte Rickard J
Bought by
Rickard J Sitte 2022 Ret
Current Estimated Value
Purchase Details
Closed on
Apr 7, 2006
Sold by
Murray Kim M
Bought by
Seery Jannise N and Seery Michael J
Home Financials for this Owner
Home Financials are based on the most recent Mortgage that was taken out on this home.
Original Mortgage
$303,200
Interest Rate
6.26%
Mortgage Type
Purchase Money Mortgage
Purchase Details
Closed on
Dec 11, 2003
Sold by
Murray Brian K and Murray Kim M
Bought by
Murray Kim M
Purchase Details
Closed on
Apr 29, 1998
Sold by
Hebert Raymond J
Bought by
Murray Brian K and Murray Kim M
Home Financials for this Owner
Home Financials are based on the most recent Mortgage that was taken out on this home.
Original Mortgage
$169,700
Interest Rate
7.04%
Mortgage Type
Purchase Money Mortgage
Create a Home Valuation Report for This Property
The Home Valuation Report is an in-depth analysis detailing your home's value as well as a comparison with similar homes in the area
Home Values in the Area
Average Home Value in this Area
Purchase History
| Date | Buyer | Sale Price | Title Company |
|---|---|---|---|
| Rickard J Sitte 2022 Ret | -- | None Available | |
| Seery Jannise N | $379,000 | -- | |
| Murray Kim M | -- | -- | |
| Murray Brian K | $189,700 | -- |
Source: Public Records
Mortgage History
| Date | Status | Borrower | Loan Amount |
|---|---|---|---|
| Previous Owner | Murray Brian K | $286,500 | |
| Previous Owner | Seery Jannise N | $303,200 | |
| Previous Owner | Murray Brian K | $164,000 | |
| Previous Owner | Murray Brian K | $169,700 |
Source: Public Records
Tax History Compared to Growth
Tax History
| Year | Tax Paid | Tax Assessment Tax Assessment Total Assessment is a certain percentage of the fair market value that is determined by local assessors to be the total taxable value of land and additions on the property. | Land | Improvement |
|---|---|---|---|---|
| 2025 | $6,491 | $500,500 | $178,600 | $321,900 |
| 2024 | $6,175 | $476,800 | $170,100 | $306,700 |
| 2023 | $5,847 | $450,100 | $160,400 | $289,700 |
| 2022 | $5,698 | $399,600 | $145,800 | $253,800 |
| 2021 | $5,409 | $362,300 | $138,900 | $223,400 |
| 2020 | $5,248 | $354,600 | $134,800 | $219,800 |
| 2019 | $5,023 | $337,100 | $122,900 | $214,200 |
| 2018 | $4,989 | $329,100 | $122,900 | $206,200 |
| 2017 | $4,862 | $316,300 | $122,900 | $193,400 |
| 2016 | $4,703 | $301,300 | $122,900 | $178,400 |
| 2015 | $4,568 | $296,800 | $120,500 | $176,300 |
| 2014 | $4,379 | $284,900 | $114,700 | $170,200 |
Source: Public Records
Map
Nearby Homes
- 3 Gilberts Way
- 125 John Scott Blvd
- 127 John Scott Blvd
- 27 Run Brook Cir
- 225 S Worcester St Unit 1
- 225 S Worcester St Unit 2
- 165 Taunton Ave
- 8 Kasmira Way
- 1 Round Farm Rd
- 48 Round Farm Rd
- 178 S Worcester St
- 170 S Worcester St Unit 3
- 196 Taunton Ave Unit B
- 198 Taunton Ave Unit A
- 198 Taunton Ave Unit B
- 53 Forest Hill Dr
- 3 Jeffrey Ln
- 4 Smith St
- 985 Glebe St
- 34 Barrows St
- 78 E Hodges St
- 82 E Hodges St
- 80 E Hodges St
- 76 E Hodges St
- 77 E Hodges St
- 59 E Hodges St
- 86 E Hodges St
- 84 E Hodges St
- 86 E Hodges St Unit 86-86
- 81 E Hodges St
- 70 E Hodges St
- 87 E Hodges St
- 57 E Hodges St
- 90 E Hodges St
- 90 E Hodges St Unit 1
- 88 E Hodges St
- 1 Mary Joe Rd
- 89 E Hodges St
- 5 Gilberts Way
- 0 Richmond Dr Lot 14