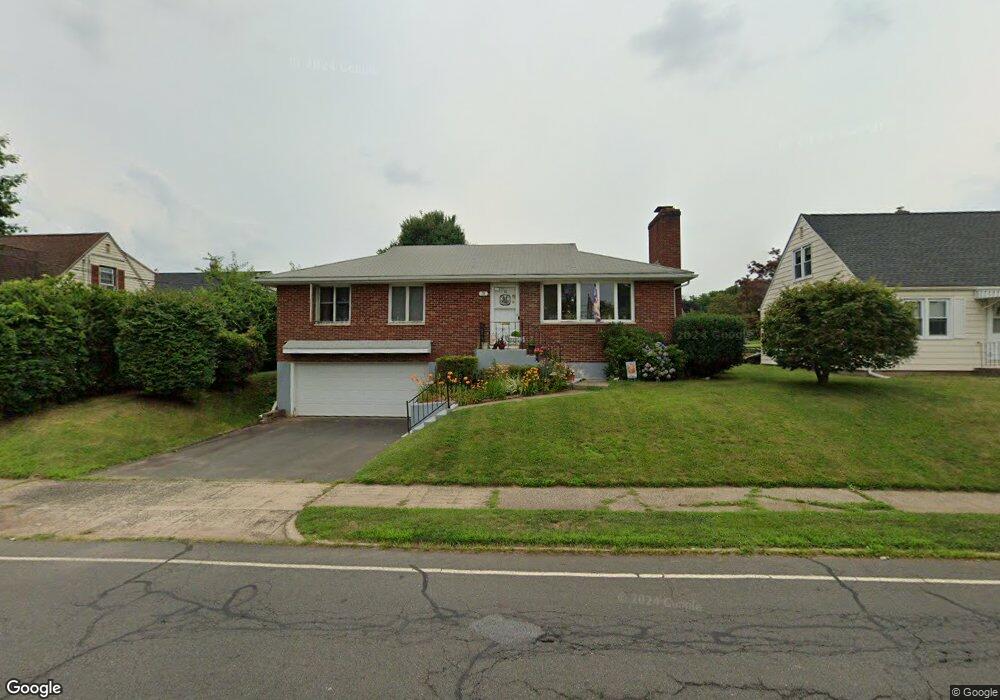
78 East St New Britain, CT 06051
Estimated Value: $273,652 - $302,000
2
Beds
2
Baths
1,232
Sq Ft
$230/Sq Ft
Est. Value
About This Home
This home is located at 78 East St, New Britain, CT 06051 and is currently estimated at $283,663, approximately $230 per square foot. 78 East St is a home located in Hartford County with nearby schools including Slade Middle School, St Paul School, and Mountain Laurel Sudbury School.
Ownership History
Date
Name
Owned For
Owner Type
Purchase Details
Closed on
Jul 28, 2022
Sold by
Mojica Jose A and Mojica Ines
Bought by
Jimenez Marie C and Ferrer Elba I
Current Estimated Value
Purchase Details
Closed on
May 27, 1997
Sold by
Burkavage George E Est
Bought by
Mojica Jose A and Mojica Ines
Home Financials for this Owner
Home Financials are based on the most recent Mortgage that was taken out on this home.
Original Mortgage
$79,400
Interest Rate
8.08%
Mortgage Type
Unknown
Create a Home Valuation Report for This Property
The Home Valuation Report is an in-depth analysis detailing your home's value as well as a comparison with similar homes in the area
Home Values in the Area
Average Home Value in this Area
Purchase History
| Date | Buyer | Sale Price | Title Company |
|---|---|---|---|
| Jimenez Marie C | -- | None Available | |
| Mojica Jose A | $80,000 | -- |
Source: Public Records
Mortgage History
| Date | Status | Borrower | Loan Amount |
|---|---|---|---|
| Previous Owner | Mojica Jose A | $78,000 | |
| Previous Owner | Mojica Jose A | $79,400 |
Source: Public Records
Tax History Compared to Growth
Tax History
| Year | Tax Paid | Tax Assessment Tax Assessment Total Assessment is a certain percentage of the fair market value that is determined by local assessors to be the total taxable value of land and additions on the property. | Land | Improvement |
|---|---|---|---|---|
| 2025 | $4,868 | $124,250 | $34,930 | $89,320 |
| 2024 | $4,919 | $124,250 | $34,930 | $89,320 |
| 2023 | $4,756 | $124,250 | $34,930 | $89,320 |
| 2022 | $4,505 | $91,000 | $16,100 | $74,900 |
| 2021 | $4,505 | $91,000 | $16,100 | $74,900 |
| 2020 | $4,596 | $91,000 | $16,100 | $74,900 |
| 2019 | $4,596 | $91,000 | $16,100 | $74,900 |
| 2018 | $4,596 | $91,000 | $16,100 | $74,900 |
| 2017 | $4,468 | $88,480 | $16,100 | $72,380 |
| 2016 | $4,468 | $88,480 | $16,100 | $72,380 |
| 2015 | $4,336 | $88,480 | $16,100 | $72,380 |
| 2014 | $4,336 | $88,480 | $16,100 | $72,380 |
Source: Public Records
Map
Nearby Homes