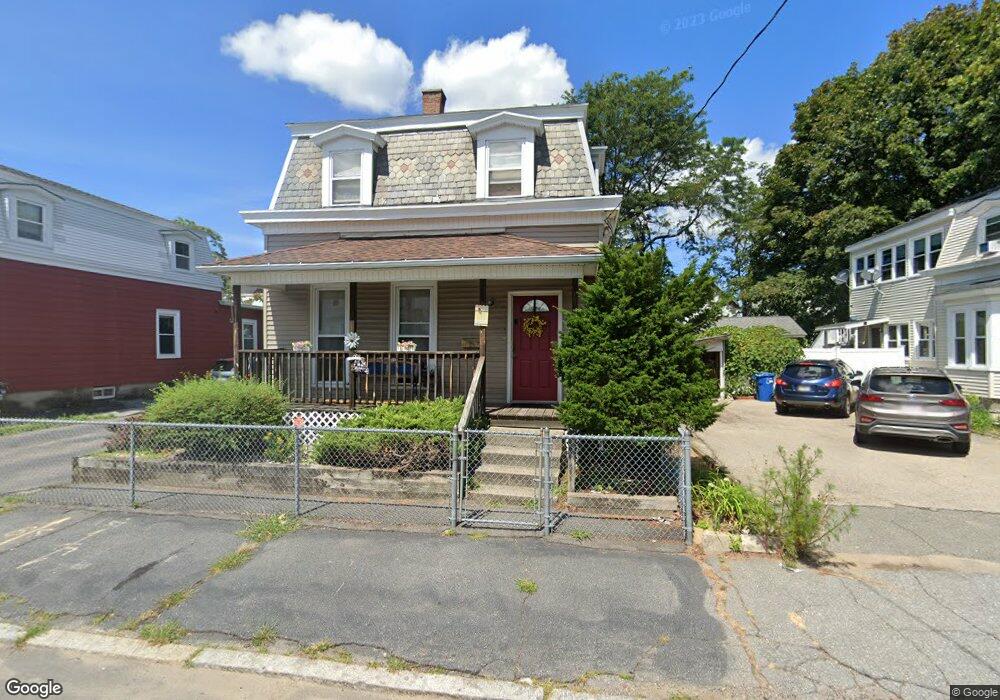
78 Farnham St Lawrence, MA 01843
South Common NeighborhoodEstimated Value: $466,000 - $531,000
4
Beds
1
Bath
1,656
Sq Ft
$306/Sq Ft
Est. Value
About This Home
This home is located at 78 Farnham St, Lawrence, MA 01843 and is currently estimated at $507,533, approximately $306 per square foot. 78 Farnham St is a home located in Essex County with nearby schools including Vardaman Elementary School, Olive Branch Elementary School, and Rowan Elementary School.
Ownership History
Date
Name
Owned For
Owner Type
Purchase Details
Closed on
Mar 26, 2025
Sold by
Hanson Richard A
Bought by
Richard A Hanson Ret and Hanson
Current Estimated Value
Purchase Details
Closed on
Sep 29, 1995
Sold by
Gilchrist Ruth E
Bought by
Hanson Richard A
Create a Home Valuation Report for This Property
The Home Valuation Report is an in-depth analysis detailing your home's value as well as a comparison with similar homes in the area
Home Values in the Area
Average Home Value in this Area
Purchase History
| Date | Buyer | Sale Price | Title Company |
|---|---|---|---|
| Richard A Hanson Ret | -- | None Available | |
| Richard A Hanson Ret | -- | None Available | |
| Hanson Richard A | $53,200 | -- | |
| Hanson Richard A | $53,200 | -- |
Source: Public Records
Mortgage History
| Date | Status | Borrower | Loan Amount |
|---|---|---|---|
| Previous Owner | Hanson Richard A | $44,500 | |
| Previous Owner | Hanson Richard A | $10,000 | |
| Previous Owner | Hanson Richard A | $18,620 | |
| Previous Owner | Hanson Richard A | $19,262 |
Source: Public Records
Tax History Compared to Growth
Tax History
| Year | Tax Paid | Tax Assessment Tax Assessment Total Assessment is a certain percentage of the fair market value that is determined by local assessors to be the total taxable value of land and additions on the property. | Land | Improvement |
|---|---|---|---|---|
| 2025 | $3,516 | $399,600 | $107,800 | $291,800 |
| 2024 | $3,297 | $356,400 | $116,700 | $239,700 |
| 2023 | $3,396 | $334,300 | $108,200 | $226,100 |
| 2022 | $3,156 | $275,900 | $98,000 | $177,900 |
| 2021 | $3,052 | $248,700 | $98,000 | $150,700 |
| 2020 | $2,804 | $225,600 | $93,000 | $132,600 |
| 2019 | $2,891 | $211,300 | $77,200 | $134,100 |
| 2018 | $2,635 | $184,000 | $73,200 | $110,800 |
| 2017 | $2,562 | $167,000 | $69,100 | $97,900 |
| 2016 | $2,416 | $155,800 | $56,900 | $98,900 |
| 2015 | $2,356 | $155,800 | $56,900 | $98,900 |
Source: Public Records
Map
Nearby Homes
- 91 Farnham St
- 27-29 Dorchester St
- 356-360 S Union St
- 132-134 S Broadway
- 82 S Broadway
- 19 Front St
- 111 Cambridge St Unit D
- 13 Kingston St
- 64 Salem St
- 67-69 Osgood St
- 41 Durham St
- 49 Bowdoin St Unit 51
- 78-80 Osgood St
- 77-79 Shawsheen Rd
- 91-93 Newton St
- 24 Inman St Unit 32
- 46 Loring St
- 629 Andover St
- 80 Market St
- 5 Lafayette Ave