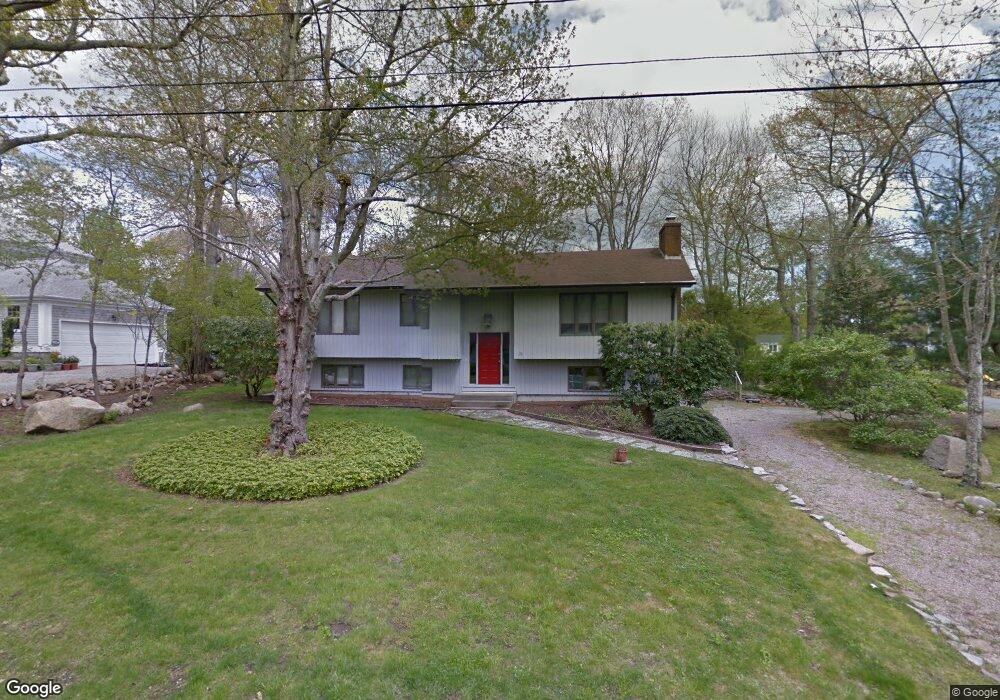
78 Gounod Rd Westerly, RI 02891
Estimated Value: $1,048,489 - $1,290,000
4
Beds
3
Baths
1,343
Sq Ft
$859/Sq Ft
Est. Value
About This Home
This home is located at 78 Gounod Rd, Westerly, RI 02891 and is currently estimated at $1,153,122, approximately $858 per square foot. 78 Gounod Rd is a home located in Washington County with nearby schools including Westerly High School.
Ownership History
Date
Name
Owned For
Owner Type
Purchase Details
Closed on
Mar 27, 2023
Sold by
Read Moly S and Sexton Joseph A
Bought by
Sexton Six Llc
Current Estimated Value
Purchase Details
Closed on
Feb 1, 2018
Sold by
Sexton Richard
Bought by
Richard J Sexton 2017 and Sexton
Purchase Details
Closed on
Nov 24, 1992
Sold by
Porzio Pascal and Porzio Alma
Bought by
Lexton Richard and Lexton Joan
Home Financials for this Owner
Home Financials are based on the most recent Mortgage that was taken out on this home.
Original Mortgage
$100,000
Interest Rate
7.95%
Mortgage Type
Purchase Money Mortgage
Create a Home Valuation Report for This Property
The Home Valuation Report is an in-depth analysis detailing your home's value as well as a comparison with similar homes in the area
Home Values in the Area
Average Home Value in this Area
Purchase History
We collect this data history from publicly available records. To have your information removed, we recommend requesting removal directly through your county’s website.
| Date | Buyer | Sale Price | Title Company |
|---|---|---|---|
| Sexton Six Llc | -- | None Available | |
| Richard J Sexton 2017 | -- | -- | |
| Sexton Richard | -- | -- | |
| Lexton Richard | $258,000 | -- | |
| Lexton Richard | $258,000 | -- |
Source: Public Records
Mortgage History
We collect this data history from publicly available records. To have your information removed, we recommend requesting removal directly through your county’s website.
| Date | Status | Borrower | Loan Amount |
|---|---|---|---|
| Previous Owner | Lexton Richard | $100,000 |
Source: Public Records
Tax History
| Year | Tax Paid | Tax Assessment Tax Assessment Total Assessment is a certain percentage of the fair market value that is determined by local assessors to be the total taxable value of land and additions on the property. | Land | Improvement |
|---|---|---|---|---|
| 2025 | $6,664 | $937,300 | $648,600 | $288,700 |
| 2024 | $7,119 | $725,700 | $463,200 | $262,500 |
| 2023 | $6,981 | $725,700 | $463,200 | $262,500 |
| 2022 | $6,938 | $725,700 | $463,200 | $262,500 |
| 2021 | $6,222 | $540,100 | $332,400 | $207,700 |
| 2020 | $6,109 | $540,100 | $332,400 | $207,700 |
| 2019 | $6,049 | $540,100 | $332,400 | $207,700 |
| 2018 | $5,737 | $482,900 | $302,200 | $180,700 |
| 2017 | $5,597 | $482,900 | $302,200 | $180,700 |
| 2016 | $5,640 | $482,900 | $302,200 | $180,700 |
| 2015 | $5,338 | $493,300 | $308,400 | $184,900 |
| 2014 | $5,249 | $493,300 | $308,400 | $184,900 |
Source: Public Records
Map
Nearby Homes
- 85 Gounod Rd
- 137 Cove Point Rd E
- 25 Robin Way
- 853 W Beach Rd
- 39 Brookside Dr
- 5 Robin Hollow Ln
- 34 Sandpiper Ln
- 112 Noyes Neck Rd
- 5 Sunnyside Dr
- 7 Fenway Rd
- 11 Bucks Trail
- 31 Ninigret Ave
- 32 Breach Dr
- 22 Breach Dr
- 135 Ross Hill Rd
- 263 Post Rd
- 148 Ross Hill Rd
- 635 Atlantic Ave
- 5717 Post Rd
- 17 Clifford Dr
Your Personal Tour Guide
Ask me questions while you tour the home.