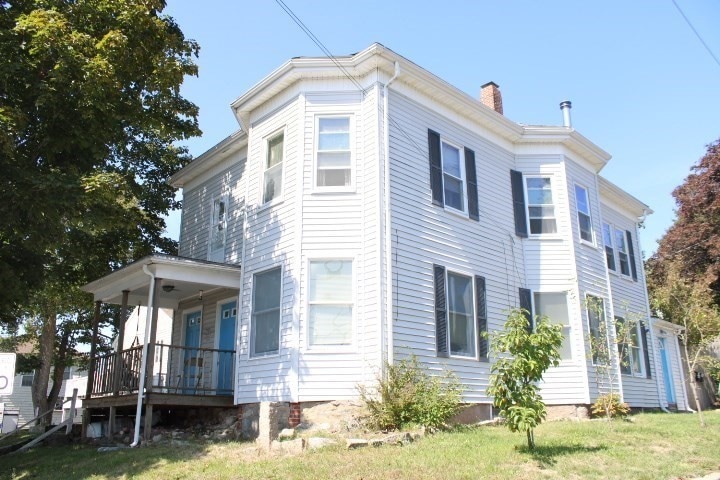
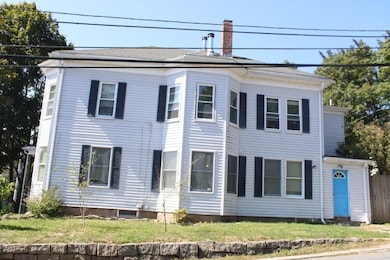
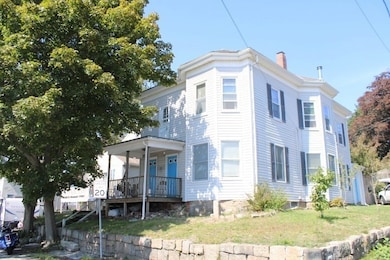
78 Grove St Gloucester, MA 01930
Central Gloucester NeighborhoodEstimated payment $4,474/month
Highlights
- Marina
- Granite Flooring
- Deck
- Medical Services
- Fruit Trees
- Property is near public transit
About This Home
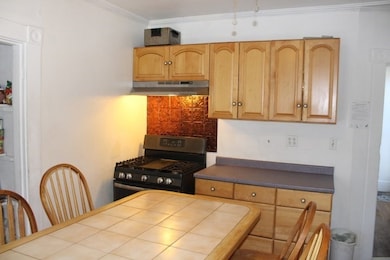
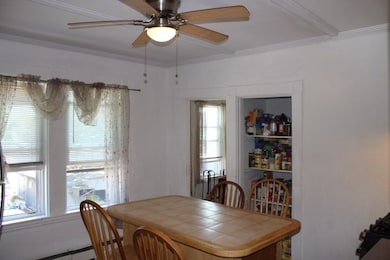
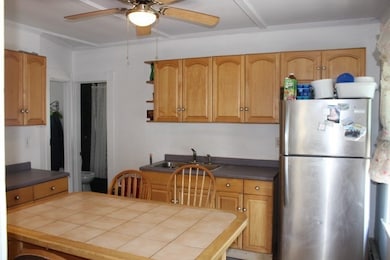
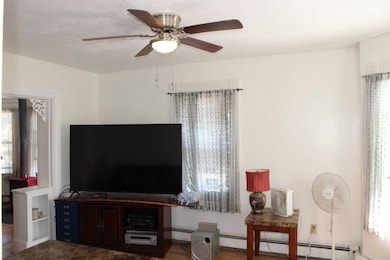
Central Gloucester owner occupied 2 family with nice floor plan in each unit! Spacious living rooms, formal dining rooms, and eat in kitchens! Unit 1 first floor has 2 BR. Unit 2 (Owner's unit) has 3 BR's and features 2 levels with a large primary BR suite on 3rd floor with huge walk-in closet. Separate utilities and separate laundry facilities for each unit! Full basement. Easy care fenced rear yard with patio and garden area. Ample paved parking with 4 car tandem for owner's unit and a separate 2 car parking area for rental unit. Low maintenance vinyl siding and replacement windows. 2 woodstoves help with heating bills. Quick access to Rt. 128, T station, downtown Gloucester and Gloucester Crossing shopping plaza!
Property Details
Home Type
- Multi-Family
Est. Annual Taxes
- $5,520
Year Built
- Built in 1900
Lot Details
- 5,000 Sq Ft Lot
- Corner Lot
- Level Lot
- Cleared Lot
- Fruit Trees
- Garden
Home Design
- Duplex
- Stone Foundation
- Frame Construction
- Shingle Roof
Interior Spaces
- 2,544 Sq Ft Home
- Property has 1 Level
- Cathedral Ceiling
- Ceiling Fan
- Skylights
- Insulated Windows
- Sliding Doors
- Insulated Doors
- Living Room
- Dining Room
- Storage
- Home Security System
- Range
Flooring
- Wood
- Carpet
- Granite
- Tile
Bedrooms and Bathrooms
- 5 Bedrooms
- 2 Full Bathrooms
- Bathtub with Shower
Laundry
- Dryer
- Washer
Unfinished Basement
- Basement Fills Entire Space Under The House
- Interior Basement Entry
- Block Basement Construction
Parking
- 6 Car Parking Spaces
- Stone Driveway
- Paved Parking
- Open Parking
- Off-Street Parking
Outdoor Features
- Balcony
- Deck
Location
- Property is near public transit
- Property is near schools
Schools
- O/Maley Middle School
- Gloucester High School
Utilities
- No Cooling
- Heating System Uses Natural Gas
- Individual Controls for Heating
- Baseboard Heating
- Separate Meters
- 220 Volts
- 100 Amp Service
Listing and Financial Details
- Rent includes unit 1(water), unit 2(water)
- Tax Lot 42
- Assessor Parcel Number 1895858
Community Details
Overview
- 2 Units
Amenities
- Medical Services
- Shops
Recreation
- Marina
- Tennis Courts
- Park
- Jogging Path
Building Details
- Insurance Expense $2,300
- Water Sewer Expense $2,000
- Operating Expense $4,300
- Net Operating Income $7,700
Map
Home Values in the Area
Average Home Value in this Area
Tax History
| Year | Tax Paid | Tax Assessment Tax Assessment Total Assessment is a certain percentage of the fair market value that is determined by local assessors to be the total taxable value of land and additions on the property. | Land | Improvement |
|---|---|---|---|---|
| 2025 | $5,520 | $567,900 | $138,100 | $429,800 |
| 2024 | $5,424 | $557,400 | $131,600 | $425,800 |
| 2023 | $5,603 | $529,100 | $117,500 | $411,600 |
| 2022 | $5,246 | $447,200 | $102,200 | $345,000 |
| 2021 | $5,072 | $407,700 | $92,900 | $314,800 |
| 2020 | $4,803 | $389,500 | $92,900 | $296,600 |
| 2019 | $4,457 | $351,200 | $92,900 | $258,300 |
| 2018 | $4,149 | $320,900 | $92,900 | $228,000 |
| 2017 | $3,898 | $295,500 | $83,700 | $211,800 |
| 2016 | $3,654 | $268,500 | $83,600 | $184,900 |
| 2015 | $3,586 | $262,700 | $83,600 | $179,100 |
Property History
| Date | Event | Price | List to Sale | Price per Sq Ft |
|---|---|---|---|---|
| 11/12/2025 11/12/25 | For Sale | $760,000 | 0.0% | $299 / Sq Ft |
| 10/08/2025 10/08/25 | Off Market | $760,000 | -- | -- |
| 09/18/2025 09/18/25 | For Sale | $760,000 | -- | $299 / Sq Ft |
Purchase History
| Date | Type | Sale Price | Title Company |
|---|---|---|---|
| Deed | $335,000 | -- | |
| Deed | $318,900 | -- | |
| Deed | $330,000 | -- | |
| Deed | $128,000 | -- |
Mortgage History
| Date | Status | Loan Amount | Loan Type |
|---|---|---|---|
| Open | $183,000 | No Value Available | |
| Closed | $185,000 | Purchase Money Mortgage | |
| Previous Owner | $255,120 | Purchase Money Mortgage |
Source: MLS Property Information Network (MLS PIN)
MLS Number: 73432543
APN: GLOU-000040-000042
Disclaimer: Certain information contained herein is derived from information provided by parties other than Homes.com. All information provided is deemed reliable, but is not guaranteed to be accurate and should be independently verified.
![]() The property listing data and information, or the Images, set forth herein were provided to MLS Property Information Network, Inc. from third party sources, including sellers, lessors and public records, and were compiled by MLS Property Information Network, Inc. The property listing data and information, and the Images, are for the personal, non-commercial use of consumers having a good faith interest in purchasing or leasing listed properties of the type displayed to them and may not be used for any purpose other than to identify prospective properties which such consumers may have a good faith interest in purchasing or leasing. MLS Property Information Network, Inc. and its subscribers disclaim any and all representations and warranties as to the accuracy of the property listing data and information, or as to the accuracy of any of the Images, set forth herein.
The property listing data and information, or the Images, set forth herein were provided to MLS Property Information Network, Inc. from third party sources, including sellers, lessors and public records, and were compiled by MLS Property Information Network, Inc. The property listing data and information, and the Images, are for the personal, non-commercial use of consumers having a good faith interest in purchasing or leasing listed properties of the type displayed to them and may not be used for any purpose other than to identify prospective properties which such consumers may have a good faith interest in purchasing or leasing. MLS Property Information Network, Inc. and its subscribers disclaim any and all representations and warranties as to the accuracy of the property listing data and information, or as to the accuracy of any of the Images, set forth herein.
- 19 Mystic Ave
- 40 Sargent St
- 65 Poplar St
- 119 Pleasant St
- 33 Maplewood Ave Unit 21
- 6 Beauport Ave
- 3 Stone Ct
- 18 Cherry St
- 7 Harold Ave
- 4 Mount Vernon St
- 8 Summer St Unit 103
- 90 Middle St Unit L
- 22 Taylor St Unit 1
- 5 Washington Square
- 52 Taylor St
- 40 Middle St Unit 2
- 160 Prospect St Unit 3
- 33 Middle St
- 191 Main St Unit 2B
- 191 Main St Unit 3
- 9 Hawthorne Rd Unit 2
- 28 Millett St Unit 2
- 41 Trask St
- 2 School House Rd
- 13 Exchange Street-Winter Rental
- 4 Reservoir Rd Unit A
- 10 Commonwealth Ave Unit 2
- 55 Prospect St Unit 2
- 97 Washington St Unit 3rd floor
- 10 Gloucester Ave Unit B
- 9 Foster St Unit 2
- 8 Angle St Unit C
- 17 Silva Ct Unit 3
- 41 Western Ave Unit 2
- 61 Western Ave Unit 1
- 129 Essex Ave Unit 3
- 145 Essex Ave Unit 309
- 145 Essex Ave Unit 622
- 169 E Main St Unit 169 #B
- 950 Heights at Cape Ann
